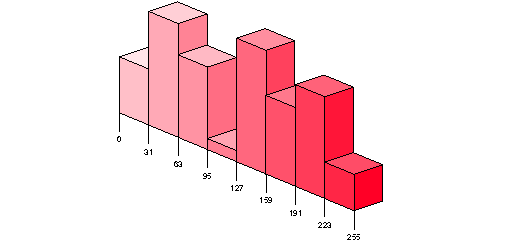
Figure 7-3 illustrates how the histogram extension collects information for one of the color components: The histogram has the number of bins specified at creation, and information is then collected about the number of occurrences of that color component. Assuming the example below is for the red component of an image, you can see that R values between 95 and 127 occurred least often and those between 127 and 159 most often.
Figure 7-3 : How the Histogram Extension Collects Information Histogram and minmax operations are performed only for RGBA pixel groups, though these groups may have been specified as color indexes and converted to RGBA by color index table lookup.