WebSphere Studio Application Developer 5.0 - Profiling
INTRODUCTION/OBJECTIVES
This workshop takes you through the steps of using the new profiling tooling
in WebSphere Studio Application Developer
version 5.0 (hereafter called Application Developer).
In this workshop, we will examine the performance characteristics
of Access Beans versus straight JNDI access.
Note: This workshop requires that
the following products are installed:
- WebSphere Studio Application Developer Early Availability Version
5.0
- IBM Agent Controller (part of WebSphere Studio Application
Developer Early Availability Version 5.0)
- DB2 UDB 7.2 FP 7
|
Note: This workshop requires that
the following lab was completed:
- EJB QL - Stock Purchase Reports
|
Section 1 - Setup
___ 1. Overview
The Profiling tools collect data related to a Java program's run-time
behavior, and present this data in the profiling views. This helps you to
visualize your program execution easily, and explore different patterns within
the program.
The tools are useful for performance analysis, and for
gaining a deeper understanding of your Java program. You can use them
to view object creation and garbage collection, execution sequences,
thread interaction, and object references. They also enable you to
see which operations take the most time, and help you to find and solve
memory leaks. You can easily identify repetitive execution behavior and
eliminate redundancy, while focusing on the highlights of an execution.
Profiling can gather information on applications running
as a standalone Java application, inside an application server such
as WebSphere Application Server, on the same machine as Application
Developer, on a remote machine from Application Developer and in multiple
JVMs.
In this lab, we will import a new Web application, WBProfilingWeb,
to the existing WBStockPurchase Enterprise Application. We will
generate a new Access Bean for the Customer EJB. The new Web application
contains a servlet that will access customer information either directly
or through the Access Bean. We will use the Profiling tools to examine
the different performance characteristics of the two types of access.
___ 2. Generate Customer Access Bean
WBProfilingServlet uses the CustomerAccessBean
to retrieve the Customer information. We will generate the Access
Bean.
a. Start Application Developer if not already started.
b. Click on File->New->Other....
c. On the Select dialog, select EJB in the
left-hand pane and Access Bean in the
right-hand pane.
Click the Next> button.
d. On the Select an Access Bean Type dialog, select
Java bean wrapper.
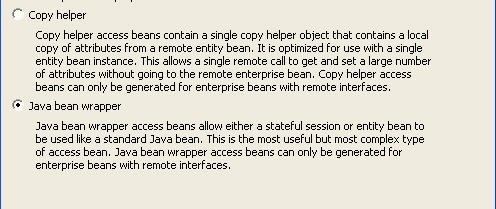
Click the Next> button.
e. On the Select EJB Project dialog, select WBStockPurchaseEJB
as the EJB Project and check the
selection box for the Customer Enterprise Bean.
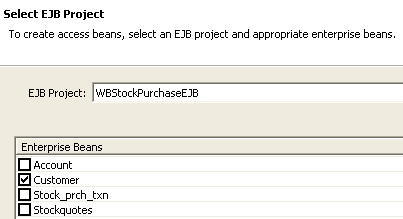
Click the Finish button.
___ 3. Import Web project
a. Go to a Web perspective if one is open. If
a Web perspective is not open, open one by
clicking on the Open a Perspective button and clicking
Other...->Web.
b. This application will be in a Web project called
WBProfilingWeb. Click File->Import....
c. On the Select dialog, click WAR file. Click
the Next> button.
d. On the Identify the WAR File and Import Options dialog,
click the Browse... button next to the WAR File entry field.
Browse to and select \WS50STEW\hands-on\Profiling\WBProfilingWeb.war.
For Web project, ensure New is selected
and enter WBProfilingWeb for the New Project
name.
For Enterprise application project, select Existing.
Click the Browse... button next to the Existing
project name entry field. Browse to and select WBStockPurchase.
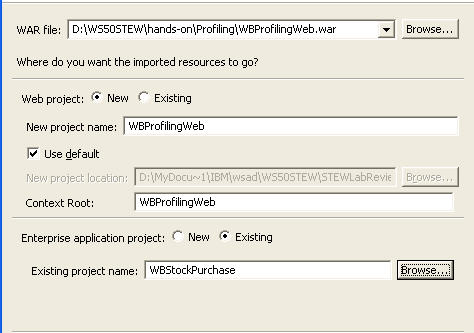
Click the Finish button. Do not overwrite any existing
files.
On the Repair Server Configuration
dialog, click OK to add
WBProfilingWeb to the WBStockPurchase
EAR project.
There will be a number of errors. We will fix those next.
e. Select WBProfilingWeb. Click mouse-button 2 and select
Properties.
f. On the Properties dialog, select Java Build Path
in the left-hand pane and click on the Projects
tab in the right-hand pane. Click the checkbox next to
WBStockPurchaseEJB.
Click the OK button.
All errors should now be gone.
Section 2 - Profiling
___ 1. Starting the WebSphere Test Environment in Profiling Mode
a. From the Web perspective, expand WB
ProfilingWeb and inside of that expand
Web Content.
b. Select WBProfilingInput.html. Click mouse-button
2 and select Profile on Server.
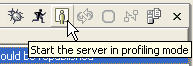
c. On the Server selection dialog, select the already
configured WebSphere v5 Unit Test. Select the checkbox
for Set this server as the preferred server. Click the
Finish button.
d. Wait for the server to start, which is indicated by
the Server server1 open for e-business message in
the console. Make sure there are no errors in the console.
WBProfilingInput.html opens in the Web perspective browser.
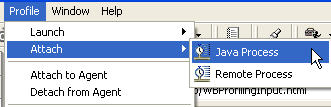
___ 2. Attach to the Java process
a. On the menu bar, select Profile->Attach->Java
Process. This is to allow us to attach to the J2EE Request
Profiler running on this machine.
Note: The J2EE Request
Profiler is an agent that resides within WebSphere Application
Server to capture data at interception points in the J2EE application,
allowing us to more easily profile J2EE applications. The J2EE Request
Profiler collect data from requests arriving on EJB containers as
well as web containers. This data enables the creation of sequence diagrams,
which represent interactions among servlets, JSPs, and enterprise beans,
while ignoring other artifacts of the application that do not represent
the business logic of the application.
You can also profile distributed J2EE applications that run either
within the boundaries of one machine or on a cluster of machines. As the
execution of the application crosses the boundaries of a host, the remote
discovery mechanism causes the attachment to other instances of the
J2EE Request Profiler which represent remote WebSphere Application
Servers. These WebSphere Application Servers host servlets and enterprise
beans that participate in the application execution.
|
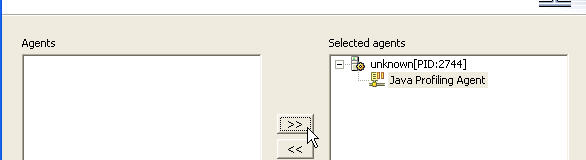
b. On the Attach to Java process dialog, in the
left-hand pane, expand the unknown process. Select
the J2EE Request Profiler and click on the double arrow
button to move J2EE Request Profiler to the
right-hand pane.
Note: If J2EE Request Profiler does not appear in the
list of agents, try the following two remedies:
1. From the Servers view, stop the WebSphere v5 Unit
Test server and restart it, making sure you start it in Profiling
mode.
2. Stop the server. Go to the Windows Services panel
and stop and restart IBM Agent Controller. Restart the
WebSphere v5 Unit Test, making sure you start it in Profiling
mode.
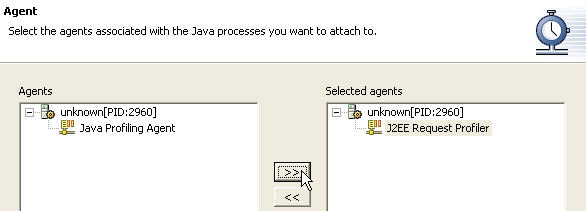
Click the Next> button.
c. The Destination dialog is where you specify what
Profiling project and Monitor to use.
Click the Finish button.
d. On the Profiling Tips pop-up message, select Do not show
this message again and click the OK button.
___ 3. Start Monitoring
a. The Profiling perspective should be opened
as a result of attaching to the Java process. If it did not, open
a Profiling perspective.
b. In the Monitors view of the Profiling perspective,
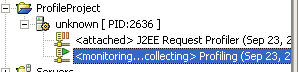
select <attached> J2EE Request Profiler.
Click mouse-button 2 and select Start Monitoring.
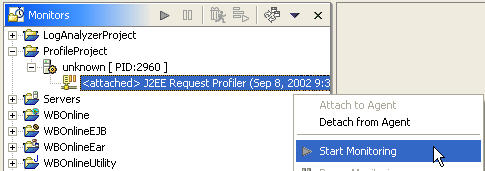
Note that you could also use the Start Monitoring
button. 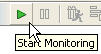
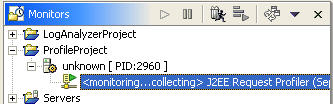
c. The selected agent should now show <monitoring...collecting>
J2EE Request Profiler.
___ 4. J2EE Request Profiler
a. Switch back to the Web perspective
and the browser view, ensuring that WBProfilingInput.html is displayed
in the browser. Select Direct access, leave
Iterations at 10 and click the Press to execute
button.
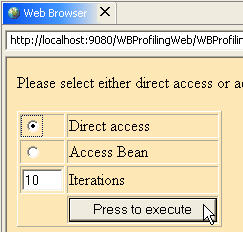
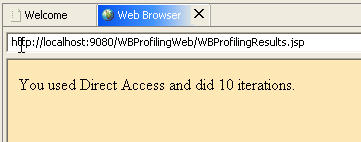
Wait until you see the WBProfilingResults.jsp screen in the browser.
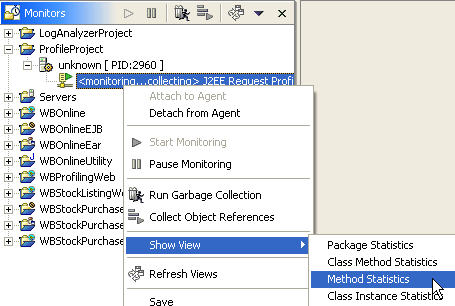
b. Switch back to the Profiling perspective. Select
<monitoring...collecting> J2EE Request
Profiler. Click mouse-button 2 and select Pause Monitoring.
Click mouse-button 2 and select Show View->Method Statistics.
c. The Method Statistics view is displayed, showing
various statistics about the methods that were called. Note that if
you need to drill down to a particular set of classes, you can filter
the displayed classes using the Filter entry
box.
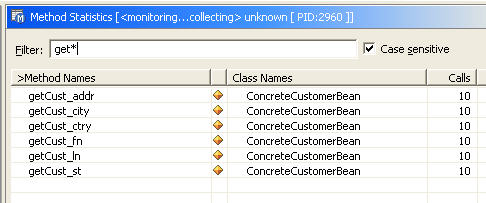
Note that this view show that the getter methods for the Customer
EJB were called ten times each. Since we specified ten for the number
of iterations, this makes sense. If these were remote EJBs, calling
these methods in this fashion could lead to performance bottlenecks.
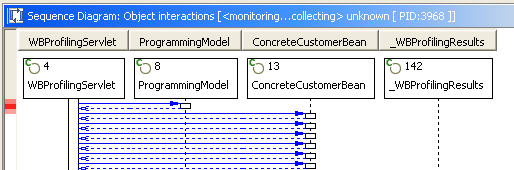
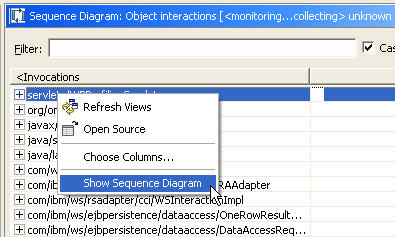
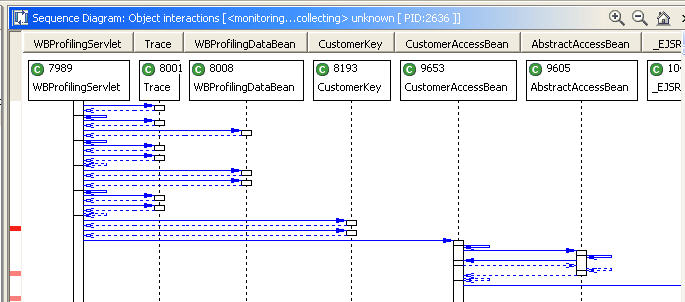
d. On the Workbench menu, click Window->Show View->Sequence
Diagram. This displays the sequence of object interactions,
a graphical representation of the execution flow of the application. We
can see that ConcreteCustomerBean is invoked many times, further reinforcing
the notion that if that component is distributed somewhere, it could
cause some performance overhead.
If we had multiple servers involved, we could show the sequence
of calls from one server to another.
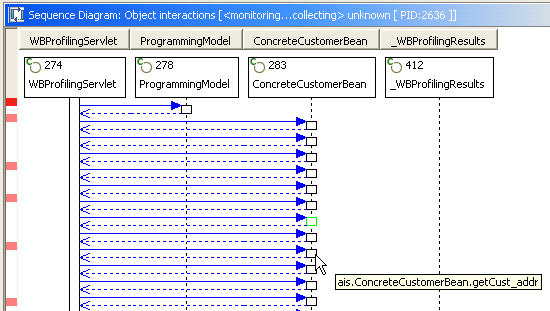
e. You can use the Time zoom in and Time zoom out buttons
to adjust how much time is displayed.
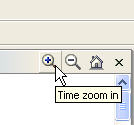
Click the Time zoom in button a few times to get more detail.
f. Drag your mouse pointer over the blue lines. The solid blue lines
represent method calls:
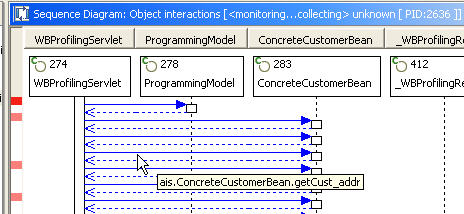
The dotted blue lines represent returns from method calls:
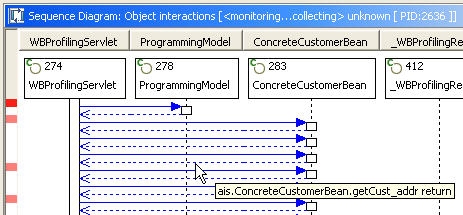
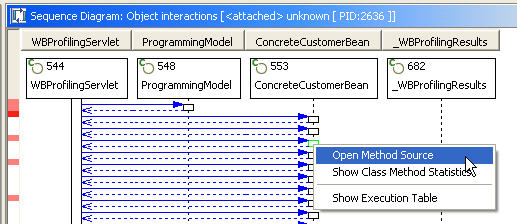
g. Drag your mouse pointer over the smaller rectangles to see the method
called in the class.
You can click mouse button to and get to the method source if needed.
h. Click the Overview button, located in the lower right
corner. 
This view shows an overview of the overall program flow. Moving the
light pink square around this view allows you to move to different points
in your application. If you do move the light pink square, be patient
as the screen refresh may take a moment.
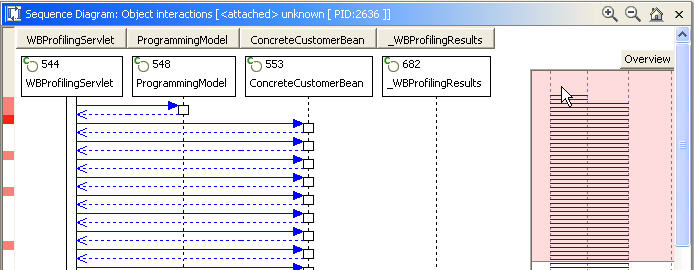
Click the Overview button again to restore the normal
view.
i. By moving your mouse pointer from rectangle to rectangle, you get
a visual representation of the program execution flow. We see that the
ConcreteCustomerBean is called by WBProfilingServlet.
We don't know which method called ConcreteCustomerBean because that
information is not captured by the J2EE Request Profiler.
___ 5. Java Profiling Agent
a. Now let's attach to and monitor our own WBProfileWeb
application. On the menu, click Profile->Attach->Java Process.
Note: The
Java Profiling Agent is an agent that attaches to a JVM to capture
and record the behavior of a Java application. The data represents all the
interactions within the JVM. To collect only data of interest, filters
can be enabled to disregard classes and objects with specified packaging
name patterns.
|
b. On the Attach to Java process dialog, in the left-hand
pane, expand the unknown process. Select the Java
Profiling Agent and click on the double arrow
button to move Java Profiling Agent to the
right-hand pane.
c. Click the Next> button.
d. The Destination dialog is where you specify what Profiling
project and Monitor to use.
Click the Next> button.
e. The Profiling Filters dialog is displayed. This is where
you specify what classes to monitor or exclude from monitoring. Note that
many system classes are excluded from monitoring when using the default
filter set.
Click the Next> button.
f. The Profiling Options dialog is displayed. This is where
you specify additional Profiling options.
Click the Finish button.
g. In the Monitors view of the Profiling perspective,
select <attached> Profiling. Click mouse-button
2 and select Start Monitoring.
The selected agent should now show <monitoring...collecting>
Profiling.
h. Switch back to the Web perspective and the browser view.
Click the Back button on the browser to display WBProfilingInput.html.
Select Access Bean, leave Iterations at 10 and
click the Press to execute button.
i. Switch back to the Profiling perspective. In the Monitors
view, make sure you have the Profiling agent select (<attached>
Profiling). Click mouse-button 2 and select Pause Monitoring.
On the workbench menu, click Profile->Refresh
Views.
j. In the Monitors view, make sure you have the Profiling
agent selected (<attached> Profiling). Make sure the
Method Statistics tab view is selected. Numerous
methods are displayed in the view. Knowing that we were concerned with
the getCust* methods, enter getCust* for the Filter and
press Enter.
Fewer methods are displayed.
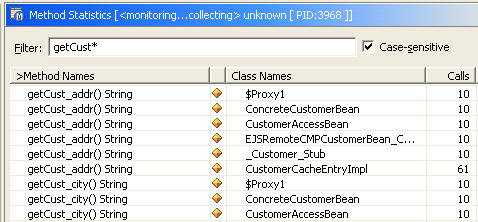
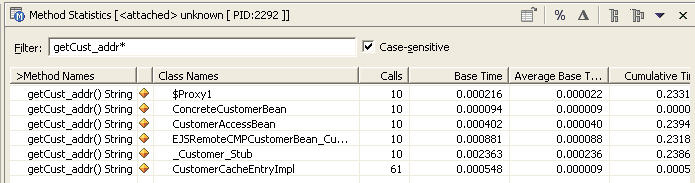
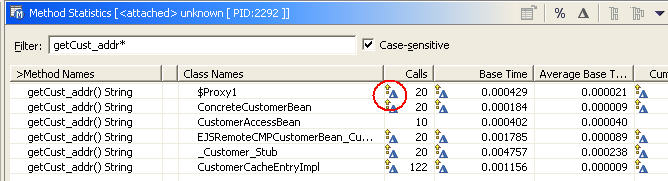
k. Focusing on just getCust_addr (enter getCust_addr*
as the filter), we see that this method exists in numerous classes.
It was called ten times in ConcreteCustomerBean
and ten times in CustomerAccessBean, implying that the CustomerAccessBean
called the ConcreteCustomerBean for each iteration.
l. Select <attached> Profiling in the
Monitors view. Click mouse-button 2 and
select Show View->Class Method Statistics.
This view shows us the method information arranged by classes. Numerous
classes are displayed.
m. Enter *Customer*Bean for the Filter and press Enter.
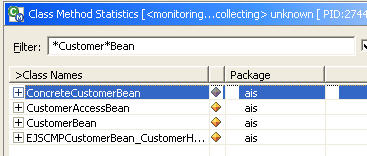
n. Fully expand ConcreteCustomerBean, CustomerAccessBean and
CustomerBean. Note that getCust_addr was called
ten times in both CustomerAccessBean and ConcreateCustomerBean,
again implying that CustomerAccessBean was
called instead of ConcreteCustomerBean.
o. Select <attached> Profiling in the
Monitors view. Click mouse-button 2 and
select Show View->Object Interactions.
Note: If you do not see a Sequence Diagram, then
in the Sequence Diagram: Object interactions pane, click mouse-button
2 and select Show Sequence Diagram.
p. The Sequence Diagram appears. Remember, this is a graphical
representation of the execution flow of the application. Note that using
the Java Agent instead of the J2EE Request Profiler Agent, we see each class
and method. If you scroll this view to the right, you will see all the
classes that get called. All this data could be overwhelming, depending
on what is being analyzed. This is one of the reasons the J2EE Request Profiler
is valuable.
q. Go back to the Method Statistics view. Note that the Base
Time for getCust_addr() method when called from CustomerAccessBean
is fairly low, while the Cumulative Time is
higher. This points out that the Base Time for a method is the time
spent executing this method only. It does not include time spent in other
Java methods that this method calls. Cumulative Time, on the other
hand, is the time the method spends on the execution stack, including both
time spent in the method itself and in other methods that it calls.
___ 6. Comparing Direct EJB calls to Access Bean
calls
a. In the Monitors
view, make sure you have the Profiling agent select (
<attached> Profiling). Click mouse-button 2 and select Start
Monitoring.
b. Switch back to the Web perspective and the browser view. Click
the Back button on the browser to display WBProfilingInput.html.
Select Direct Access, leave Iterations at 10
and click the Press to execute button.
c. Switch back to the Profiling perspective. In the Monitors
view, make sure you have the Profiling agent select (
<attached> Profiling). Click mouse-button 2 and select Pause
Monitoring.
d. On the Workbench menu, click Profile->Refresh
Views.
e. Go back to the Method Statistics view. Note that there is a
new visual icon, indicating that the data in the view has been updated.
f. Enter getCustomer as the method Filter.
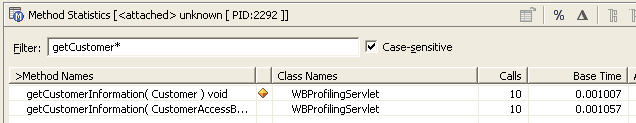
We see that the overhead of using a Access Bean is very small. Calling
the EJB directly (represented by getCustomerInformation( Customer )
) and calling using the Access Bean (represented by getCustomerInformation(
CustomerAccessBean )) has almost the same Base Time. Generating the
Access Bean took almost no development time using Application Developer
and once generated the Access Bean can be treated as just another Java Bean
by the development staff.
We looked at the characteristics of the two different ways of accessing
EJB data, one using direct access and the other using Application Developer
generated Access Beans. We examined various views for both the J2EE Request
Profiler agent and the Java Profiling agent and saw how the J2EE Request
Profiler helps filter data when looking at a J2EE application.
g. In the Monitors view of the Profiling perspective, select
<attached> Profiling. Click mouse-button
2 and select Detach from Agent.
h. In the Monitors view of the Profiling perspective,
select <attached> J2EE Request Profile.
Click mouse-button 2 and select Detach from Agent.
i. Close the Profile perspective. When asked if you want to save
your profiling data, click No.
j. Stop the WebSphere v5 Unit Test server.
Congratulations, you've completed the
Profiling lab for WebSphere Studio Application Developer
5.0!