ICAT Debugger
About This Book
The ICAT Debugger
Main Debugging Windows
Monitors Windows
Expressions Supported
Notices
This document contains information to help you install, get started,
and perform tasks with the Interactive Code Analysis Tool (ICAT)
debugger.
If you need assistance from any window while using the debugger, press
F1 from any window or choose the Help menu.
The IBM Interactive Code Analysis Tool (ICAT)
Debugger is used for debugging OS/2
device drivers, kernel code,
Installable File Systems (IFS),
and applications
that are running on an OS/2 Warp Version 4+ remote machine.
The debugger helps you detect and diagnose errors in
code written in C, C++, and assembler languages at the source level.
The
ICAT Debugger (hereafter referred to in this document as the
debugger) is a source-level debugger which uses
OS/2 Warp Version 4+
to assist in detecting and diagnosing
errors in
an OS/2 Warp Version 4+ system.
It provides a graphical
user interface and debugs PM and non-PM (single- or multi-threaded)
applications
as well as device drivers and other system-level binaries.
This debugger has been designed to
debug remotely an OS/2 Warp Version 4+ system.
The Kernel Debugger (KDB)
runs on a target OS/2 Warp Version 4+
computer and replies to debug service
requests that are sent from the debugger
while running on an Intel-based
OS/2 Warp Version 4+ computer.
The supported communications mode between
the target and host computers is serial or UDP.
Supported debug file formats include HLL (which is
IBM VisualAge C++ (VACPP)) and CodeView (CV).
This section lists the minimum hardware and software requirements,
options for compiling and linking your program,
environment variables, and limitations.
- Intel® Pentium® processor
- 11MB hard disk space
- A null-modem cable connected to serial ports on both the host
OS/2 computer and target computer or both the host and target computers
must be connected to a local area network (LAN).
There are software requirements for
both the target computer where the programs are debugged and run and the
host computer where the debugger runs.
Target Computer
- OS2KRNLD
- KDBNET.SYS (if communicating via LAN)
OS/2 Warp Host Computer
Before using the debugger, you need to compile and link your program.
For VACPP programs, use the following options:
- /Ti+
- Compiles your program to
produce an object file that includes line number information
and a symbol table in addition to the source code.
- /O-
- Compiles your program with optimization off.
This is the default.
- /Oi-
- Compiles your program with inlining off. This is the default.
- /DEbug
- Links your program to produce an executable file that includes
line number information and a symbol table in addition to the
executable code.
Note: When you specify the /Ti+
option with the /DEbug option, icc
passes this option to the linker automatically, so you only need to
use it if you link separately from the compile.
For more information about compiling and linking your program,
refer to IBM C++ Tools Programming Guide.
For Microsoft CL, CL386, MASM, and MASM386 programs, use the following
options:
- /Zi
- Compiles your program to
produce an object file that includes line number information
and a symbol table, in addition to the source code.
- /Od
- Compiles your program with optimization off.
- /CO
- Links your program to produce an executable file that includes
line number information and a symbol table in addition to the
executable code.
For Watcom wpp386 programs, use the following options:
- -d2
- Compiles your program with full debugging information.
- -hc
- Compiles your program emitting CodeView debug format
(currently, the debugger only supports Watcom's CodeView
debug format).
- -od
- Compiles your program with optimization off.
For the Watcom linker, wlink, use this option:
- d codeview
- Links your program with CodeView debug format.
The debugger supports a separate debug file (from your created
application) for the Watcom compiler. For the Watcom linker,
wlink, use this option to create a separate debug file if desired:
op symf
This creates a .sym file. Be careful not to confuse
this file with a KDB .sym file. The debugger looks for debug
information first in the application file. If it doesn't find it,
it looks for the debug information in a .dbg file and then in
a .sym file as a last resort. Most users rename the separate
Watcom .sym file to a .dbg file.
The Debugger enables you to view limited symbol information
in the Disassembly view of an executable file compiled with no debug
information if a separate symbol file is supplied.
Using the link symbol information from a separate symbol file
(*.sym) function names are annotated to the disassembly lines
for function calls and function entry points, making it easier for
you to navigate through disassembly code.
To enable viewing of the symbol information in Disassembly view:
Whether the executable is located on the target machine, or both host
and target machines, there is no difference in performance.
Currently, the symbol file must be located on the host machine.
If the executable to be debugged was compiled to enable a separate map
file to be generated, then the symbol file is obtained by running the
MapSym.exe utility on that map (.map) file. Make certain that
the symbol file has the same name as the executable.
The debugger uses environment variables to manage
debugging sessions and remote communication.
To set the environmental variables, edit the SETICAT.CMD file.
The environment variables should be set in the OS/2
session where the debugger is to be run.
Following is a list of the variables and a description of each:
- CAT_MACHINE
- Serial Communication
Specifies which host COM port the debugger uses to communicate
with KDB and the baud rate for communication.
This variable has the following form:
COMx:nnnn
where x identifies the port (for example, 1 for COM1) and
nnnn specifies the baud rate. The following rates are
supported:
- 9600 (the default)
- 19200
- 38400
- 57600
- 115200
For speeds above 19200, you need buffered UARTs on both the host
and target computers. For speeds above 57600, you need customized
serial drivers such as SIO.SYS or the COM.SYS that ships with Warp
Version 4+
(which can also be used with earlier versions of Warp).
For example, type the following at the command prompt:
SET CAT_MACHINE=COM2:57600
Note: Ensure that your communication port is enabled if you use
a ThinkPad.
-
- LAN Communication
Specifies the IP address and KDB port number of the target computer.
This variable has the following form:
x.x.x.x:nnnn
where x.x.x.x is the IP address and nnnn
specifies the KDB port number.
For example, type the following at the command prompt:
SET CAT_MACHINE=9.242.116.9:1000
- CAT_SETUP_RATE
-
Sets the baud rate at which the debugger communicates with KDB in
serial mode.
When the debugger first attempts to communicate with KDB, it does so at
the baud rate specified by this environment variable or at 9600 baud
if this variable is not defined. If the communication succeeds, the
debugger changes the baud rate to the rate specified by the
CAT_MACHINE environment variable and proceeds. Otherwise, the debugger
tries to initiate contact at the rate specified by the CAT_MACHINE
environment variable. If neither attempt succeeds, the debugger issues
an error message.
In most cases, you do not need to set CAT_SETUP_RATE. It is
primarily useful if you have been communicating with the target computer
directly (for example, using ZOC or T)
and have left the serial line running
at a rate other than 9600 baud that does not match the rate specified by
the CAT_MACHINE environment variable.
This variable is ignored if the debugger communicates using the LAN.
Additionally, if this environment variable is set, the debugger
resets KDB to this rate when the debugger is closed.
For example, type the following at the command prompt:
SET CAT_SETUP_RATE=9600
- CAT_HOST_BIN_PATH
-
Tells the debugger where to find your debug binaries (the .SYS
and .EXE files with debug information) on your host computer.
For example, type the following at the command prompt:
SET CAT_HOST_BIN_PATH=I:\SDE\SAMDETW
- CAT_COMMUNICATION_TYPE
-
Tells the debugger the type of communication you want to use.
This must be set to ASYNC_SIGBRK for serial communication
and UDP for LAN communication.
For example, type the following at the command prompt for serial
communication:
SET CAT_COMMUNICATION_TYPE=ASYNC_SIGBRK
or type the following for LAN communication:
SET CAT_COMMUNICATION_TYPE=UDP
- CAT_HOST_SOURCE_PATH
-
Tells the debugger where to find your source.
See "Finding Source Files" for more information.
For example, type the following at the command prompt:
SET CAT_HOST_SOURCE_PATH=I:\SDE\SAMDETW;E:\ICAT\TESTCASES\SRC
- CAT_PATH_RECURSE
-
Causes a recursive search of the subdirectories below the subdirectories
listed in CAT_HOST_BIN_PATH and CAT_HOST_SOURCE_PATH.
For example,
with CAT_HOST_SOURCE_PATH=I:\SDE\SAMDETW, the debugger searches the
SAMDETW subdirectory and all subdirectories below SAMDETW as well as
their subdirectories. The default is NULL, which means
the debugger does not perform a recursive search. When the variable
is set to any non-null value, the recursive search is performed.
For example, type the following at the command prompt:
SET CAT_PATH_RECURSE=ON
- CAT_SOURCE_PATH_RECURSE
-
Causes a recursive search of the subdirectories listed in
CAT_HOST_SOURCE_PATH.
For example,
with CAT_HOST_SOURCE_PATH=I:\SDE\SAMDETW,
the debugger searches the
SAMDETW subdirectory and all subdirectories below SAMDETW as well as
their subdirectories. The default is NULL, which means
the debugger does not perform a recursive search of
source subdirectories.
When the variable
is set to any non-null value, the recursive search
of source subdirectories is performed.
For example, type the following at the command prompt:
SET CAT_SOURCE_PATH_RECURSE=ON
If CAT_PATH_RECURSE is set ON, the debugger performs as if
both CAT_BINARY_PATH_RECURSE and
CAT_SOURCE_PATH_RECURSE are ON.
- CAT_BINARY_PATH_RECURSE
-
Causes a recursive search of the subdirectories listed in
CAT_HOST_BIN_PATH.
For example,
with CAT_HOST_BIN_PATH=I:\SDE\SAMDETW,
the debugger searches the
SAMDETW subdirectory and all subdirectories below SAMDETW as well as
their subdirectories. The default is NULL, which means
the debugger does not perform a recursive search of
binary subdirectories.
When the variable
is set to any non-null value, the recursive search of binary
subdirectories is performed.
For example, type the following at the command prompt:
SET CAT_BINARY_PATH_RECURSE=ON
If CAT_PATH_RECURSE is set ON, the debugger performs as if
both CAT_BINARY_PATH_RECURSE and CAT_SOURCE_PATH_RECURSE are ON.
- CAT_MODULE_LIST
-
Tells the debugger about which modules to obtain information.
By default, the debugger obtains information about every
executable module (DLL, EXE, device driver, and so on)
running on the target computer.
As a result, it can take a few minutes to attach to the
target computer.
If the CAT_MODULE_LIST environment variable is defined,
the debugger only obtains information about a module if its name appears
in the environment variable string.
(The debugger always obtains information about the kernel itself.)
This can dramatically reduce the amount
of time it takes for the debugger to initialize.
For example, type the following at the command prompt:
SET CAT_MODULE_LIST=SAMPLEDD.SYS SAMPLE.EXE
The debugger only obtains information on the kernel and the two
modules
listed in CAT_MODULE_LIST. (If a program named LE.EXE were running, the
debugger would also obtain information on it since LE.EXE is a substring of
SAMPLE.EXE.)
- CAT_RESUME
-
Tells the debugger to resume execution.
During debugger initialization, the debugger stops the target computer
in order to establish the desired baud rate. The debugger then
continues its initialization and eventually allows the user to
attach to the
target computer. By default, the debugger does not allow the
target computer to resume execution during this interval.
This behavior is necessary to
debug a system that has already reached a failure or that contains a
hardcoded INT3 instruction (as device drivers often do).
There could be situations where you want to initialize the debugger but
somehow time your attach to the target computer using the
Attach button. In
this case, define CAT_RESUME, and then the debugger
resumes the target computer waiting for your attach command to stop it
again.
For example, type the following at the command prompt:
SET CAT_RESUME=ON
- CAT_DIAL and CAT_MODEM_INIT
-
Tells the debugger to set up the COM port
specified by the
CAT_MACHINE environment variable so that the debugger can talk to a modem.
The debugger then issues the modem
attention string (+++) followed by
the string specified by the CAT_MODEM_INIT variable (if any) to initialize
the modem. The debugger then issues the string specified by the CAT_DIAL
variable (if any) and waits 500 seconds for the remote modem to answer.
Note: The host and target computers can be connected
directly (with a null-modem serial cable) or by a modem.
The CAT_MODEM_INIT environment variable should be
based on the string your terminal emulator uses to initialize the modem.
This string presumably doesn't change very often. Once you have
determined the correct AT commands, you can keep the
CAT_MODEM_INIT environment variable constant and
change CAT_DIAL when you need to place calls to different numbers.
For example, type the following at the command prompt:
   SET CAT_MODEM_INIT=ATZ
   SET CAT_DIAL=ATDT4840
- CAT_OVERRIDE
- Specifies a path that the debugger searches first to find
the source files that were used to build your debug binaries. See
"Finding Source Files"
for a complete description of the process.
For example, type the following at the command prompt:
SET CAT_OVERRIDE=e:\temp\updates
- CAT_TAB
- Specifies the number of spaces between tab stops when source
code containing tabs is displayed in a debugger window.
For example, type the following at the command prompt:
SET CAT_TAB=5
The debugger converts each tab in the source to 5
spaces when the source is displayed.
- CAT_TAB_GRID
- Specifies the column positions for the tab stops when source
code containing tabs is displayed in a debugger window.
For example, typing the following command
at the command prompt sets tab stops at the 6th position:
SET CAT_TAB_GRID=6
- CAT_DEBUG_NUMBER_OF_ELEMENTS
-
Represents the default number of elements displayed for a
variable or structure that has a substantial number of elements.
The last element displayed for such a structure is labeled
"more elements."
Clicking on this entry displays the next
n elements of the variable or structure.
Note: CAT_DEBUG_NUMBER_OF_ELEMENTS is an environment variable that is set to an
integer, n.
For example, type the following at the command prompt:
SET CAT_DEBUG_NUMBER_OF_ELEMENTS=100
The next 100 elements are displayed.
- CAT_DEBUGGER_NAME
-
Specifies a name that displays on the title bar of the Debug Session
Control window to identify the debugger session.
For example, type the following at the command prompt:
SET CAT_DEBUGGER_NAME=target 1
This is useful if you want to run multiple copies of the debugger
from a single host computer to debug multiple systems.
The search path tells the debugger where to find
the source file used in the source windows.
The debugger searches for the source files in the following order:
- The path defined by the CAT_OVERRIDE environment variable,
if specified.
- The directory where the object file was compiled.
- The path defined by the CAT_HOST_BIN_PATH environment variable,
if specified.
- The directory where the executable file is located.
- The path defined by the CAT_HOST_SOURCE_PATH
environment variable, if specified.
- The current directory.
- The path defined in the INCLUDE environment variable.
- The directory of the last source file found in this debug session.
Notes:
-
The CAT_PATH_RECURSE environment variable, if specified, causes
the debugger to search recursively all subdirectories of the
CAT_HOST_BIN_PATH and CAT_HOST_SOURCE_PATH environment variables.
-
The CAT_BINARY_PATH_RECURSE environment variable, if specified, causes
the debugger to search recursively all subdirectories of the
CAT_HOST_BIN_PATH environment variable.
-
The CAT_SOURCE_PATH_RECURSE environment variable, if specified, causes
the debugger to search recursively all subdirectories of the
CAT_HOST_SOURCE_PATH environment variable.
The debugger has the following restriction:
-
You can not launch an application with the debugger. You can only
attach to the OS/2 Warp Version 4+ system.
In serial mode,
the target computer communicates over COM2 if COM2 exists and over COM1
otherwise.
The COM port that the target computer uses must not be usurped by
an application. For example, if the target computer is using
COM2 and you issue the following command:
mode com2
you may disrupt communication. The device driver and executables
associated with the IBM LAN Management Utilities
(for example, LMUIPL.SYS) can
also prevent the target computer from communicating.
(Note that KDB can be directed to use a particular COM port
by way of the KDB.INI file.)
Similarly, the COM port the host computer uses in serial mode
must be dedicated to the
debugger. If the debugger fails to attach, make sure
you're not running a terminal emulator (for example, T
or ZOC) in the background that has the COM port tied up.
This section describes how to set up the target and host computers,
includes a demonstration session to help you get started,
explains how to start a debugging session from
the OS/2 command prompt,
includes helpful tips, troubleshooting
and how to end a debugging session.
To set up the target network computer:
- Obtain or build an OS2KRNLD that has the
debugger packet-handling code. This code is now part
of the regular KDB builds.
- OS2KRNL is in the root directory of the target computer's
boot drive but is hidden. Use the following command to make it
visible:
attrib -r -s -h os2krnl
Use the following commands to
back up the file and replace it with its debug
equivalent:
   copy os2krnl  os2krnl.bak
   copy os2krnld os2krnl
- If debugging by way of LAN, obtain and install a copy of KDBNET.SYS
as in the following steps:
- In CONFIG.SYS, locate the line containing PROTMAN.OS2
- After this line, enter:
DEVICE=x:\y\KDBNET.SYS /V /Id.d.d.d /Ppppp
where x and y are the drive letter
and path to the directory where you
wish to store KDBNET.SYS. The IBMCOM subdirectory is probably the
most convenient place to store it.
d.d.d.d is the IP address of the target machine
pppp is the port number on which KDBNET accepts UDP data
(1000 is the recommended port number)
- Locate the PROTOCOL.INI file, which should be in the IBMCOM subdirectory.
- In the stanza that begins with [IBMLXCFG],
add the following line:
kdbnet_nif = kdbnet.nif
- Add a new stanza to PROTOCOL.INI:
[KDBNET_nif]

   Bindings = IBMFEEO2_nif
   DriverName = KDBNET$
   KDBIPADDR = "d.d.d.d"
   KDBSNETMASK = "255.255.248.0"
   KDBPORT = 1000
   NMPORT = 1001
   BCASTNOTIFY = "YES"
   NNOACTION = "C"
where d.d.d.d is
replaced with the IP address of the machine.
- Look at the other stanzas of the PROTOCOL.INI file. If the value of
"Bindings =" is something other than IBMFEE02_nif,
use that value instead of IBMFEE02_nif.
- Copy the file KDBNET.NIF to the IBMCOM\PROTOCOL subdirectory.
- Reboot the target machine. If KDBNET is properly installed,
you should see a "banner" during the bootup process.
Note: Don't reboot the target machine from the debuggers File menu if
KDBNET.SYS is installed on that target.
The debugger, KDB, and KDBNET.SYS can't resync in this
manner.
To set up the host OS/2 computer:
- Unzip the ICATOS2.ZIP file into the directory where
you want to run the debugger. This file contains the debugger, the
target sample binaries, and the original source files.
- Set the environment variables. Refer to "Environment Variables" for
more information.
This demonstration session demonstrates
a very simple set of DevIOCtl calls being made from
a sample application to a device driver. It explains some of the
actions you could take to debug this scenario at the source level.
To run the demo, follow these steps:
- Copy SAMPLEDD.SYS to the root directory of the C drive on
your target computer.
- On the target computer,
edit CONFIG.SYS so that it contains the following line:
DEVICE=C:\SAMPLEDD.SYS
This loads the sample device driver when you reboot the
target computer.
- Copy SAMPLE.EXE to your target computer.
- Reboot your target computer so that the SAMPLEDD.SYS
binary and the debug
OS2KRNL and OS2LDR binaries are instantiated.
You can perform a
quick check to see if the target computer is OK by running your normal
terminal emulator (T, ZOC, and so on). This shows if KDB is
communicating at 9600 baud.
- Shut down the terminal emulator
before you run the debugger.
- Run the SETICAT.CMD file to set the environment
variables on your host computer.
- Type icatgam. The Initialization window
is displayed.
- From the Initialization window,
select the Attach button.
- In the Debug Session Control window,
make certain you see SAMPLEDD.SYS.
Click the plus sign (+) located
next to it and notice that one entry is displayed.
Click that plus sign (+) and notice eight
entries are now displayed.
- Click STRATEGY.
The STRATEGY routine of the SAMPLEDD device driver should display in a
source window.
Note: This is
MASM source, so you will see assembler
directives, but it is source. We support both CodeView (CL and CL386)
and HLL (IBM VACPP) debug formats for C.
-
Set a breakpoint on line 209 inside the STRATEGY
routine by double-clicking on the line number. Run the
debugger by clicking the Run button.
-
On the target computer, type sample.
SAMPLE.EXE emits a DevIOCtl to
open the SAMPLEDD device driver.
-
When the debugger notifies you that the breakpoint has been encountered,
open the Registers window and then open the
Storage window. Edit one of the addresses in this Storage window by
double-clicking the address and change the address value to
that of the PC register
(located at the top of the list of status flags registers in the
Registers window).
You will see memory that corresponds to the code space.
- From the Source window, select Passthru (located within
the Monitors menu).
- In the Passthru window, type dg cs in the
Command field and click the
Send button or press Enter.
This sends the command to KDB and the output is displayed in the
response area. Notice that it provides information about
SAMPLEDD's code descriptor. You can emit most KDB commands
from the Passthru window.
Avoid commands that cause the target computer to
resume execution (for example, g and t).
Note: If you change the state of the target computer
with KDB commands in the
Passthru window, you must click the Resync button to allow the
debugger to reflect the changes.
-
Set another breakpoint on line 275 inside the Open subroutine.
Run the debugger until the breakpoint is encountered.
- Click the
Step into choice or button to do a step into
on the Ccall macro to SubrWFrame.
You are in the SubrWFrame subroutine.
Click the Call Stack icon.
- From the Call Stack window, select
the Display style choice
(located within the Options menu).
- From the Display style window, enable the
Return Address choice, which is located under the Select
items group heading. Click the OK button.
- Click the Step over choice or button and notice
the change in the Call Stack window.
-
Look at the Debug Session Control window
and find SAMPLE.EXE. Click the plus sign (+)
and notice that one part is displayed.
Click that plus sign (+) and you will see MAIN.
-
Click MAIN and set a breakpoint at line 44. Run the
debugger by clicking the Run button. The breakpoint is
encountered in the STRATEGY routine again.
- Run one more time and the breakpoint is encountered in
SAMPLE.EXE in MAIN.
After you have completed these steps,
close the debugger. At this point, you can use your terminal emulator
to communicate with KDB. If you did not use the CAT_SETUP_RATE
environment variable, KDB is set at the baud rate you used to
communicate with the debugger.
To start the debugger:
- From the OS/2 command prompt,
enter the command icatgam followed by one of the
following parameters:
- /p+
- Use program profile information.
- /p-
- Do not use any program profile information.
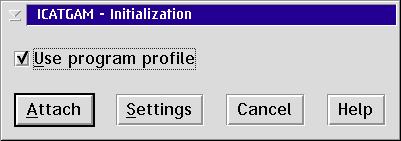
The Initialization window is displayed.
Figure 1. Initialization Window
Note: It's usually a good idea to have set up your environment
variables by way of a SETICAT.CMD file before invoking the debugger.
See "Environment Variables" for more information.
- If you're going to debug a program more than once, select the
Use Program Profile check box to reactivate the windows
and breakpoints.
- Click the Attach button to attach the debugger to the
OS2KRNL.
- Click the Settings button to display the
Debugger Properties window, which enables you to set environment
variables.
See "Setting Debugger Properties" for more information.
A tool bar has been provided on the debugger windows
for easier access to frequently used features.
To display buttons in a window, enable the
Tool Buttons choice (located
within the Options menu).
The following is a list of features that are provided:

- Step over
executes the current line in the program. If the current line is a
call, execution is halted when the call is completed.

- Step into
executes the current line in the program. If the current line is a
call, execution is halted at the first statement in the called function.

- Step debug
executes the current line in the program.
The debugger steps over any function for which debugging information is
not available (for example, library and system routines)
and steps into any function for which debugging information is available.

- Step return
automatically executes the lines of code
up to and including the return statement of the current function.

- Run allows you to start and stop the program.
When the debugger is running, the Run button
is disabled and the
Halt button
 is enabled.
You can click on the Halt button to halt the program
execution. You can also interrupt the program you are debugging
by selecting the Halt choice from the Run
menu.
is enabled.
You can click on the Halt button to halt the program
execution. You can also interrupt the program you are debugging
by selecting the Halt choice from the Run
menu.

- View
changes the current source window to one of the other source windows.
For example, you can switch from the
Disassembly window to the Mixed window.

- Monitor Expression
enables you to type in the name of the expression you want to monitor.

- Call Stack
enables you to
view all of the active functions for a particular thread including
the system calls.
The functions are displayed in the order that they were called.

- Registers
enables you to
view all the processor and coprocessor registers for a particular
thread.

- Storage
displays the storage contents and the address of the storage.

- Messages
displays printfs emitted by the kernel (diagnostic) code.

- Breakpoints
enables you to view all the breakpoints that have been set.

- Passthru
enables you to send commands and receive responses from KDB directly.

- Debug Session Control
displays the Debug Session Control window.
This is the main window for the debugger and runs during the
complete session.

- Growth direction
enables you to change the direction that items are
displayed on the stack.

- Delete
enables you to delete the highlighted item.

- Delete all
enables you to delete all the items in the window.

- 32-float
displays the storage contents as a 32-bit floating point.

- 64-float
displays the storage contents as a 64-bit floating point.

- 32-bit unsigned
displays the storage contents as a 32-bit unsigned integer.

- 32-bit signed
displays the storage contents as a 32-bit signed integer.

- ASCII
displays the storage contents in ASCII.

- Hex and ASCII
displays the storage contents in Hex and ASCII.

- Change representation
enables you to change the data representation.
The following tips and hints might be helpful:
-
You must have OS/2 Warp Version 4+
on your host machine.
-
If CAT_HOST_BIN_PATH points
to a remote-mounted drive, the drive must be
mounted in binary mode.
- Put any environment variables that you want set in a command file.
For example, you could put them in the SETICAT.CMD file or create
your own command file.
-
The DBGSTRIP utility can be used to strip debug information
from
binaries placed on the target computer
but should not be used on
binaries placed in CAT_HOST_BIN_PATH
(if you want to do source-level debugging).
-
Using C and C++, you can write your program code with
stylistic features that are not supported by the debugger.
For example, multiple statements on the same line are difficult to debug.
None of the individual statements can be accessed separately when you set
breakpoints or when you use step commands.
ICAT allows you to manipulate any thread running on the target computer.
Because certain portions of the address space are not shared by all
threads, you must be sure that you are in the proper context when you set
breakpoints, display storage, and so on.
The title of a thread-specific
window includes the thread's identifier as shown in the
Debug Session Control window (see "Debug Session Control Window").
To ensure you are in the context of the proper thread, select the thread
from the Debug Session Control window's Threads pane.
For example, you attach to the target computer and want to set
a breakpoint. If the breakpoint is in a shared region
(for example, in a device driver, a DLL, or the kernel),
it doesn't matter which context you are
in when you set the breakpoint.
But if the breakpoint is not in a shared region such as in an
EXE file, you must ensure that you are in the
context of a thread that belongs to the process that owns the region
before you set the breakpoint. Because the debugger does not necessarily
have information about every EXE file in the system, a window may
show source for a module even though the thread listed in the title of
the window is not part of the process that is running the EXE file.
If you set the breakpoint without first verifying you are in the
proper context, you will actually set a breakpoint in a different
module entirely.
Following are some things to check when the debugger is not doing what
you think it should:
To end the debugging session,
select Close debugger from the File
menu in a debugger window.
The Close Debugger window displays.
Select one of the following choices:
- Select Yes to end your debugging session.
- Select No to return to the previous screen without
exiting the debugger.
You can also end the debugging session by pressing F3 in any of the
debugger windows.
This section introduces the Debug Session Control window and
how to perform functions from this window.
It also introduces the three source
windows that offer different views of your source code.
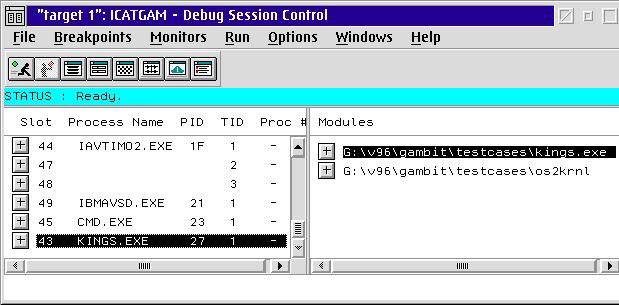
The Debug Session Control window
is the control window
of the debugger and displays during the entire debugging session.
This window is divided into two panes:
Threads and Components.
-
Threads shows the threads for the program you are debugging
and the corresponding process IDs, process names, kernel thread IDs,
and processor number (when applicable).
Right-click on a selected item to display the Thread
menu and press F1 to view help for this item.
- Components shows the components for the
program that you are debugging.
Right-click on a selected item to display the Component
menu and press F1 to view help for this item.
Figure 2. Debug Session Control Window
From the Debug Session Control window you can select menus that
enable you to:
- Open a new source file.
- Open a source window to a particular function.
- Open a source window containing the next line to be executed.
- Save the contents of the Threads pane or the Components pane into
a file.
- Reboot the target computer while the debugger stays attached.
- Open the Initialization window to start a debugging session.
- Set line, function, address, watchpoint, or
load occurrence breakpoints.
- Display a list of breakpoints that have been set.
- Monitor the call stack for a particular thread.
- Monitor registers and flags for a particular component or thread.
- Monitor the storage in your application.
- Display the local variables for your application's current
function.
- Open the Passthru window to send commands to KDB and display
KDB responses.
- Execute your application or stop execution.
- Modify how the debugger window is displayed.
You can open additional source files from the Debug Session Control
window.
To open a new source file:
- Click Open New Source
(located within the File menu).
- Type the name of the object file you want to open the source for in
the Source field.
For example, to look for the source used to compile A123.OBJ, type
the following in the Source field:
A123
If you are uncertain of the file name, click the File list
button to view a list of files that you can select.
- Type the name of the executable file in the Executable
field.
The source files for the executable file are displayed in the
Source field.
- Select the All executables check box if you want to
search all the executable files.
Clear the All executables check box to search for a
particular executable file.
- Select the Debugging information only check box if you
want to search only the source files that contain debugging information.
- Click the OK button.
You can use
the Find Function window
to open a source window to a particular function.
- Click Find function
(located within the File menu).
- Type the name of the function you want to search for in the
Function field.
If the function that you specify is not found, the following message
is displayed:
No matching function found. Desired function could be static.
This means it might be a static function or the function you specified
does not exist.
The debugger searches each object file for global functions
that match the function name specified.
If an object file contains the global function that was specified, then
it also searches that file for any static function with the same name.
- Select the Debugging information only check box
if you want to search only the object files
that contain debugging information.
- Select the Case sensitive check box
if you want to search for
the string exactly as typed. Clear this check box if you want to
search for both uppercase and lowercase characters.
- Click the OK button.
To locate the execution point in your source, click
Where is execution point
(located within the File menu).
A source window is displayed containing the next line to be executed.
If you want to save the contents of the Threads pane view in a file,
click Save thread list in file
(located within the File menu).
This saves the view in a file named threads.out.
To change the default file name,
click
Options, Window settings,
and then Display style
(located within the Debug Session Control window)
and type the file name in the Threads output file field.
If you would like to save the contents of the
Components pane view in a file,
click Save component list in file (located within the
File menu).
This saves the view in a file named comps.out.
To change the default file name,
click
Options, Window settings,
and then Display style
(located within the Debug Session Control window)
and type the file name in the Components output file field.
To reboot the target computer while the debugger stays attached,
click File and then Reboot target
(located within the Debug Session Control window).
If you want to start a debugging session, click File
and then Initialization (located within the Debug Session
Control window).
The Initialization window is displayed.
See "Starting a Debug Session" for more information.
You can control program execution by setting breakpoints. A
breakpoint stops the execution of your program at a specific location,
or when a specific event occurs.
To set breakpoints, click
the Breakpoints menu (located on the Debug Session Control
window, or located on any source window) and then click the
appropriate choice for the type of breakpoint you want to set.
When you set a breakpoint in one source window,
it is reflected in the other source windows.
In addition,
you can set a simple line breakpoint in a source window using either
the mouse or the keyboard:
- To set a breakpoint with the mouse, double-click in the
prefix area of an executable
statement. (The prefix area is the
area to the left of the source code
where line numbers or addresses are displayed.)
The prefix area is displayed in red to indicate that the breakpoint
has been set.
Double-click in the same prefix area to delete the breakpoint.
- To set a breakpoint with the keyboard, move the cursor
to the prefix area
and then press the Spacebar to set or delete a breakpoint.
Note: You can set as many breakpoints as you want.
You can set either line, function, address, watchpoint,
or set load occurrence breakpoints.
A line breakpoint enables you to stop the execution of your program
at a specific line number.
You set a line breakpoint from the Line Breakpoint window.
To display the window, from the Breakpoints menu, click
Set line.
Figure 3. Line Breakpoint Window
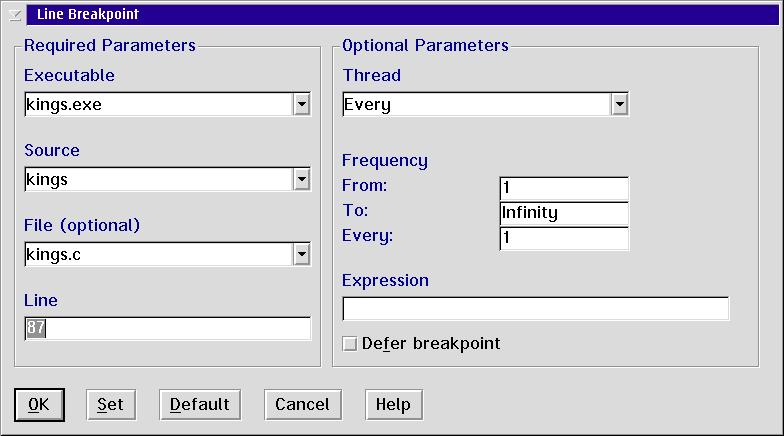
The Line Breakpoint window is divided into two group headings:
Required Parameters and Optional Parameters.
Required Parameters:
- Type a component name or click a component located within
the drop-down
list in the Executable field.
- Select the executable file in which you want to set the breakpoint.
- Type the source name or click a source located within
the drop-down list
in the Source field.
- Select the source where you want to set the breakpoint.
- If the source you selected has include files with executable
statements,
type the name of the file in the File (optional) field
or click the file name located within
the drop-down list.
All the file names that contain executable lines are displayed in
the drop-down list.
- Select the file where you want to set the breakpoint.
- Type the line number where you want to set the breakpoint in the
Line field.
Optional Parameters:
- Click the drop-down list in the Thread field.
- Select the thread where you want to set the breakpoint.
Click Every, the default, to set a breakpoint in all
of the active threads in your program.
The Every choice is thread independent.
Select one of the individual threads to set a breakpoint
in only one thread. Threads are added to the Thread
list as new threads are activated.
- Type a number in the From field to activate the
breakpoint the nth time the location is encountered.
- Type a number in the To field to stop activating the
breakpoint after the nth time the location is encountered.
- Type a number in the Every field to indicate how
often the breakpoint should be activated within the From
and To range.
Note: The Frequency fields (From, To, and Every) are
used for location, address, and load occurrence breakpoints.
- If you are setting an address, function, or line breakpoint, you can
also type in an expression. The execution of the program stops
only if this condition tests true.
For example, you could type the following:
(i==1) || (j==k) && (k!=5)
Note: Variables in a conditional expression associated with a
function breakpoint are
limited to any static or global variables that are known to the
called function when the function is called.
The debugger does not always evaluate
local variables and automatic variables correctly.
The maximum length of the condition is 256 characters.
- Click Set to set the breakpoint.
A function breakpoint stops the execution of your application
when the first instruction of the function is encountered where the
breakpoint has been set.
You set a function breakpoint from the
Function Breakpoint window.
To display the window, click Set function
(located within the Breakpoints menu).
To set a function breakpoint:
- Type a component name or click a component located within
the drop-down list
in the Executable (optional) field.
- Select the executable file where you want to set the breakpoint.
- Type the source name or click a source located within
the drop-down list
in the Source field.
- Select the source where you want to set the breakpoint.
- Type the name of the function in the Function field
where you want to set the breakpoint or
click a function located within the Function list.
If a function is overloaded,
a window is displayed with a list of all the overloaded function names.
Click the appropriate function from the list.
- Select the Debugging information only check box
if you want to search only the object files
that contain debugging information.
- Select the Case sensitive check box
if you want to search for the string exactly as typed.
Clear this check box if you want to
search for both uppercase and lowercase characters.
- Click or type optional parameters (if any).
For a description of the fields under the
Optional Parameters
group heading, see Optional Parameters.
- Click Set to set the breakpoint.
An address breakpoint enables you to
stop the execution of your application
at a specific address.
You set an address breakpoint from the
Address Breakpoint window.
To display the window, click Set address
(located on the Breakpoints menu).
To set an address breakpoint:
- Type the name of the address or expression where you want to set
the breakpoint in this field.
For example,
to set an address breakpoint for the address 0x000A1FCC, you
would type one of the following in the Address field:
0x000A1FCC or A1FCC
The 0x is optional.
- Click or type optional parameters (if any).
For a description of the fields under the
Optional Parameters
group heading, see Optional Parameters.
- Click Set to set the breakpoint.
A watchpoint stops the execution of your
application when contents of memory at a given address are referenced or
when an instruction is fetched from a particular address.
You set a watchpoint from the Watchpoint window.
To display the window, click Set watchpoint
(located within the Breakpoints menu).
To set a watchpoint:
- Type a hexadecimal address or port
or an expression that can be evaluated to
a hexadecimal address in the Address (or expression)
field.
Note: If you type ABC in the Address (or expression)
field,
and there is a variable named ABC, the
value of the variable is used instead of the hex value ABC.
Also, you can type &a in the
field to set the watchpoint on the address of
variable a.
For example, type the following in the
field to set a watchpoint for the address
A1FCC.
A1FCC
Type the following in the
field to set a watchpoint for the expression
&variable.
&variable
- Click the Watchpoint Type.
The debugger supports four types of watchpoints.
They are as follows:
- Read
- Causes a break when the address is read.
- Write
- Causes a break when the address is written to.
- Read or write
- Causes a break when the address is read from or written to.
- Instruction fetch
- Causes a break when the instruction at that address is fetched.
Attention:
If you set a watchpoint that is on the call stack, you
should remove the watchpoint before leaving the routine associated
with the watchpoint. Otherwise, when you return from the routine, the
routine's stack frame is removed from the stack leaving the
watchpoint intact. Any other routine that gets loaded on the stack
then contains the watchpoint.
You can set up to four watchpoints.
- Click or type optional parameters (if any).
For a description of the Optional Parameters
group heading, see Optional Parameters.
- Click Set to set the watchpoint.
Note: The debugger will monitor 1, 2, or 4 bytes for the type of watchpoint
operation that you select. This choice is made for you
on the Instruction fetch type.
A load occurrence breakpoint stops the execution of
your application when a specific module is loaded.
You set a load occurrence breakpoint from the
Load Occurrence window.
To display this window, click Set load occurrence
(located within the Breakpoints menu).
To set a load occurrence breakpoint:
- Type the name of the module in the Module name field.
Execution stops when the module is loaded.
To set a load occurrence breakpoint when MY.CLASS
is loaded,
you would type one of the following in the Module name
field:
MY or MY.CLASS
Note: If the CAT_MODULE_LIST environment variable has been defined and the
module's name is not contained in the CAT_MODULE_LIST, the
module is not reported.
If the module cannot be
found in the module search path, the module name is not accepted.
See "Setting Debugger Properties" for information on identifying modules.
- Click or type optional parameters (if any).
For a description of the fields under the
Optional Parameters group heading,
see Optional Parameters.
- Click Set to set the breakpoint.
The Breakpoints List window
lists all the breakpoints that have been set in your application.
It also displays the state of each breakpoint.
To display the Breakpoints List window, click
List
(located within the Breakpoint menu
of the Debug Session Control window).
Figure 4. Breakpoints List Window

The following information is provided for each breakpoint:
- The type of breakpoint
- The position of the breakpoint
- The enablement state
- The conditions under which the breakpoint is activated
From the menu on this window you can:
- Close your current debugging session.
- Delete, disable, and modify breakpoints.
- Set line, function, address, watchpoint, and load occurrence
breakpoints.
- Modify how the information in the window is displayed.
- View a list of open windows, and select any open window
to display that window.
- Display help.
Clicking Debugger properties
(located within the Options menu of the
Debug Session Control window)
enables you to select how the threads and source files
are initially displayed.
The Debugger Properties window contains three tabs:
When you click the Remote tab (located on the
Debugger Properties window),
the following page is displayed:
Figure 5. Debugger Properties Window - Remote Page
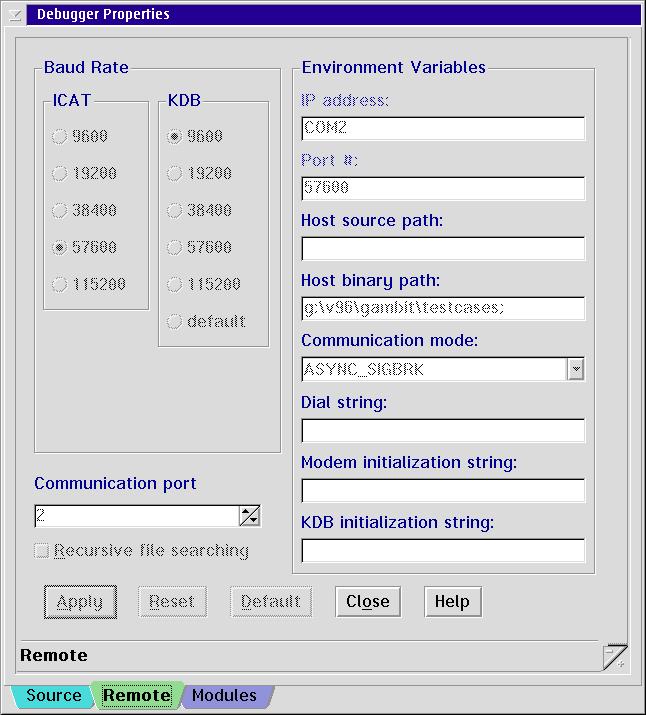
From the Remote page you can:
- Set the communication baud rate for the debugger (ICAT), if operating
in serial mode.
- If operating in serial mode,
set the baud rate at which communications are established with KDB
(this becomes the default rate).
- Set the communication port for the host, if operating in serial mode.
- Set the path where the debugger finds the source.
- Set the path where the debugger finds the debug binary modules.
- Select the communication mode (ASYNC_SIGBRK or UDP).
- Set the dial and modem initialization string if using a modem.
- Set the KDB initialization string.
- Set the option for recursive subdirectory searching of the
source and binary paths.
Note: The values for this window are dithered and cannot be changed
after communication has been established with the target computer.
To change your communication setting paths dynamically before
communication is established
with the target computer, adjust any of the
Environment Variables
fields.
See "Environment Variables" for detailed
information on environment variables.
These fields correspond respectively to the following environment
variables:
- CAT_MACHINE (Baud Rate)
- CAT_SETUP_RATE
- CAT_MACHINE (Communication port)
- CAT_HOST_SOURCE_PATH
- CAT_HOST_BIN_PATH
- CAT_COMMUNICATION_TYPE
- CAT_DIAL
- CAT_MODEM_INIT
- CAT_KDB_INIT
- CAT_PATH_RECURSE
If you select the
Recursive file searching check box
the debugger searches all source
and binary path subdirectories recursively.
When you click the Source tab (located on the
Debugger Properties window), the following page is displayed:
Figure 6. Debugger Properties Window - Source Page
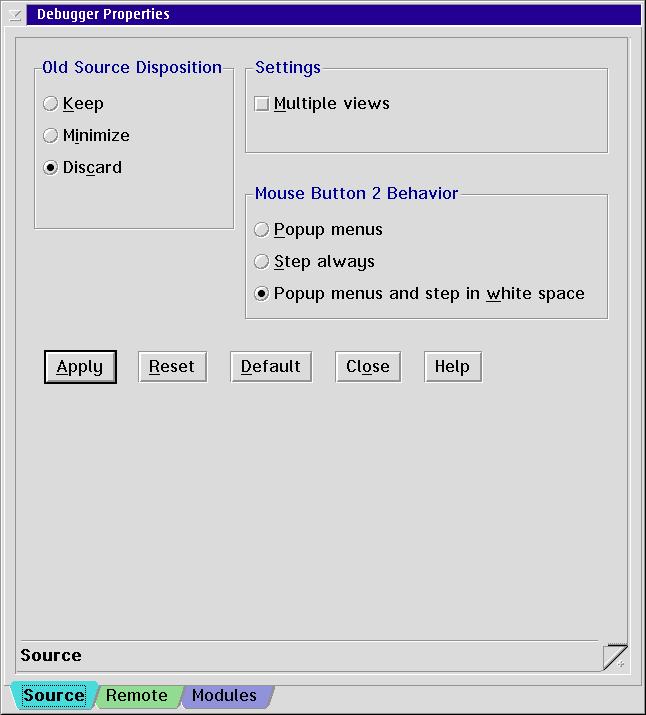
Use this page to determine:
- When a source window is displayed during a debugging session.
- How to process a source window from which execution has
just left. The window can remain displayed, be turned into an icon,
or be discarded.
To display the source view of all threads or a particular thread
when execution stops, choose any selection
located under the Display at stop group heading.
In the course of debugging, the Old Source Disposition
selections enable you to control
the behavior of source windows following command execution.
These radio buttons
control the behavior of source windows within a thread.
The dispositions that the views can take are:
- Keep
- Leaves open the source windows that contain the components and
threads
that you select with Display at stop.
- Minimize
- Changes into icons the views that contain the components and threads
that you select with Display at stop.
- Discard
- Disposes of the views that contain the components and threads
that you select with Display at stop.
You can choose to display more than one source window for a
particular source file. Enable the Multiple views
check box located under Settings if you want
multiple source windows open at the same time.
To select functions you want to perform with the right mouse button,
choose the radio button that represents the action
located under Mouse Button 2 Behavior.
When you click the Modules tab (located on the
Debugger Properties window),
the following page is displayed:
Figure 7. Debugger Properties Window - Modules Page
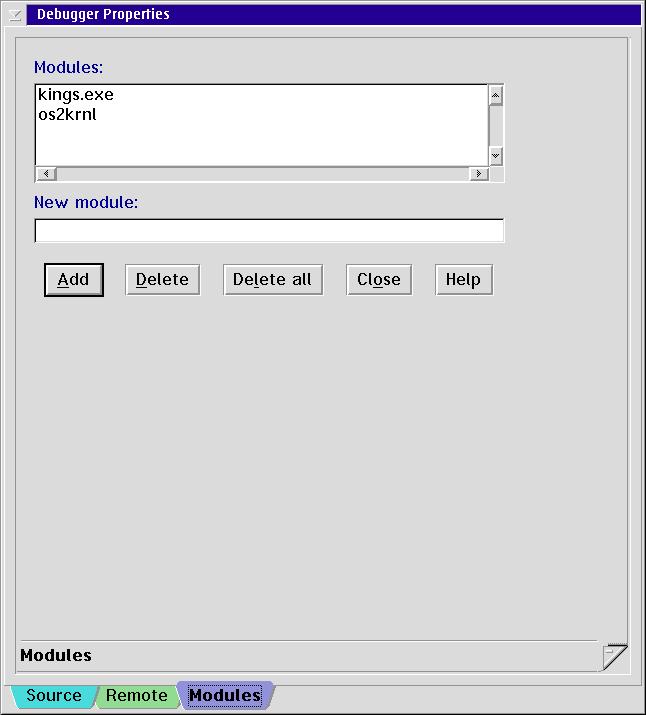
From this page you can
add a module name to or delete a module name from the
CAT_MODULE_LIST environment variable. See "Environment Variables" for
detailed information on this environment variable.
The Modules list box displays a list of
the modules that the debugger obtains information
about if or when they are loaded.
If a module is loaded and it is not in the
list, the debugger ignores the module.
To add a new module, type the name of the new module in the
New module
field and click the Add button.
You can delete a module or a group of modules,
select the modules in the
Modules list box that you would like to delete and click either
the Delete button or
the Delete all button.
To select the settings for monitoring variables or expressions:
-
Click Monitor properties
(located on the Debug Session Control window).
The Monitor Properties window is displayed.
Figure 8. Monitor Properties Window
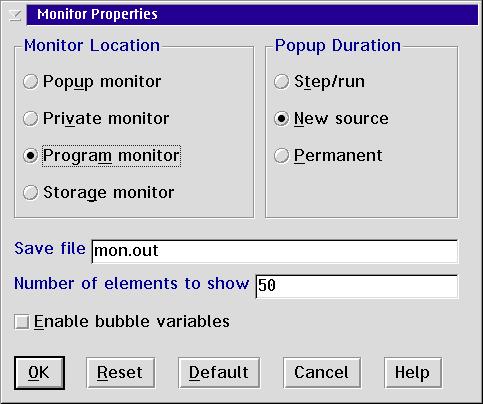
From this window you can set the following:
- The window into which the variable or expression being monitored
is placed.
- For expression windows, how long the monitor windows are displayed.
-
Define the monitor window that opens
when you select a variable or expression to monitor.
The selections you can make, and the corresponding
windows, are:
- Popup monitor
- Display the variable or expression in an expression window.
- Private monitor
- Display the variable or expression in the Private Monitor
window.
- Program monitor
- Display the variable or expression in the Program Monitor
window.
- Storage monitor
- Display the variable or expression in the Storage window.
- If you click Popup monitor,
click one of the following radio buttons to specify how long
the expression window is displayed:
- Step/run
- The monitor window closes when the next step command or
Run is executed.
- New source
- The monitor window closes when execution stops in a new source file.
- Permanent
- This monitor window is associated with a specific source window and
closes when the associated source window closes.
- Type a file name and extension in the Save file
field to identify
where all monitor windows will save their contents.
- The Number of elements to show field
identifies the maximum number of structure or class
elements that are displayed at one time for a given variable
in the monitors.
- Select the
Enable bubble variables check box
if you want a bubble value for the contents of a
variable to appear as you place the mouse pointer or the variable
in the Source, Disassembly, and Mixed view windows.
A source window enables you to view the program you are
debugging. You can view your source in one of the following
windows:
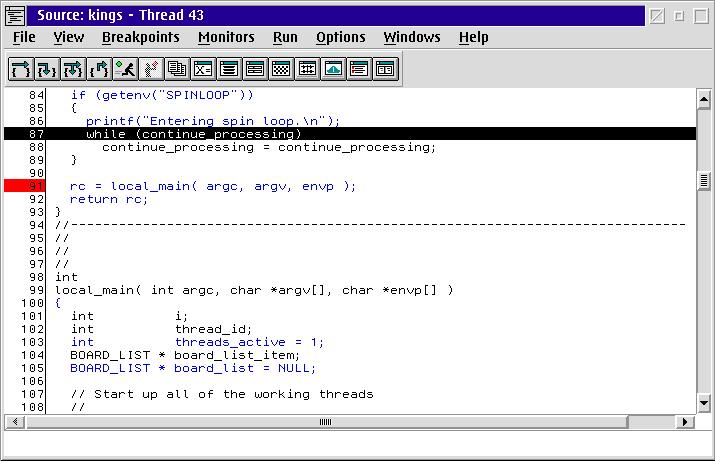
The Source window
displays the source code for
the current function of the program being debugged.
If source is available, the Source window is displayed with the
Debug Session Control window when the debugging session starts;
otherwise, the Disassembly window is displayed.
A source window is thread specific. Executable lines are
initially displayed in blue,
and nonexecutable lines are initially displayed in black.
Lines with breakpoints have a red prefix, and lines with disabled
breakpoints have a green prefix.
Figure 9. Source Window
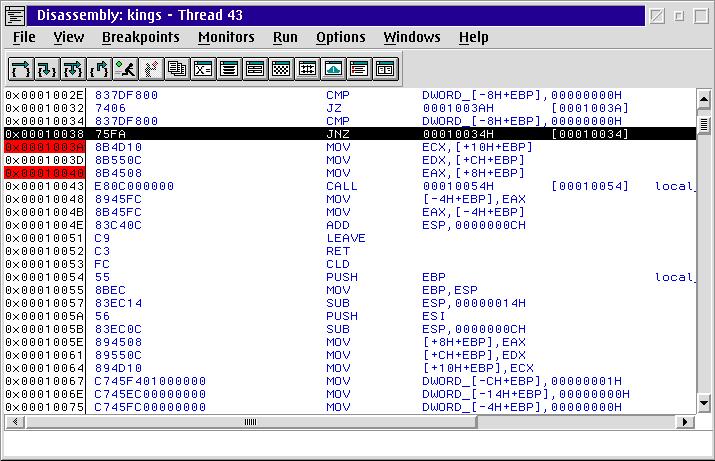
The Disassembly window displays the assembler
or bytecode instructions
for your program without symbolic information.
Figure 10. Disassembly Window
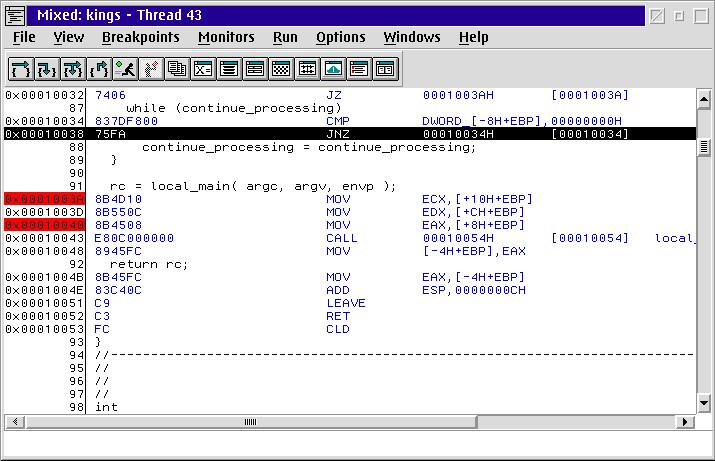
The Mixed window
displays your program as follows:
- Each line of source code is prefixed by its line number as
in the Source window.
- Each disassembled line is prefixed by an address as
in the Disassembly window.
- Source comment lines are also displayed.
- The lines of source code are treated as comments within the lines
of disassembly code.
You can only set breakpoints or run your program on lines
of disassembly code.
Note: The Mixed window cannot be opened if the source code
is not available.
Figure 11. Mixed Window
Each of the source windows have menus.
The menus are the same as the Debug Session Control window menus
(see the
Debug Session Control window menus)
with the following exceptions.
- File menu--Save to File.
This choice enables you to save the current source view to a named file.
- From the View menu, you can:
- Breakpoints menu--Toggle at
current line choice.
Toggle at current line sets a breakpoint on the current
line or deletes an existing breakpoint from the current line.
- Monitors menu--Monitor expression
Enables you to monitor expressions or variables and add them
to various monitor windows.
Note: If you need help with any of the menus, press F1 while the
menu is selected.
You can execute a program from any of the source windows (Source,
Mixed, or Disassembly) using step commands or the
Run command.
- Step commands
- Step commands control the execution of the program.
The step commands are located in the tool bar of the source
windows and under the Run menu of the source windows.
- Run command
- The Run command runs the program until a breakpoint is
encountered, the program is halted, or the program ends.
You can start the Run command from the Run button
(located on the tool bar)
or the Run menu of the source windows.
When you execute a program, a clock icon is
displayed to indicate that the program is running and
that the program might require
input to continue to the next breakpoint or termination of the program.
To open Monitors windows, from the Monitors menu
of the Debug Session Control window, click any of the following
choices:
- Call stack
- Registers
- Storage
- Local variables
- Passthru
- Other Monitor windows
These windows are also accessible from the tool bar of the source
windows.
See "Using the Tool Buttons" for more information about the tool bar.
You can view all of the active functions for a particular thread
including system calls from the Call Stack window.
The Call Stack window
lists all of the active functions for a particular thread including
system calls.
To display the Call Stack window,
click Call Stack (located within
the Monitors menu) or click the Call Stack
button (located on the tool bar).
Figure 12. Call Stack Window
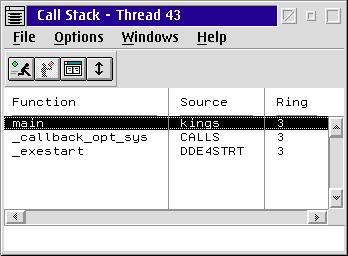
Each Call Stack window displays call stack information
for one thread only.
When the state of the program changes, such as when
you execute the program or you update displayed
data, the Call Stack window changes to reflect the
current state.
You can double-click any call stack entry to display the source code
for that entry.
The line that calls the next stack entry is highlighted.
The remaining stack size shows the bytes left in the stack for
the thread.
Note: The stack may not display correctly if the code does
not follow
standard calling conventions or if you step into optimized code.
From the menus of the Call Stack window you can:
Note: If you need help with any of the menus, press F1 while
the menu is selected.
You can view all the processor registers for a particular
thread from the Registers window.
To display the processor registers and flags,
click Registers (located within the
Monitors menu) or click the Registers
button (located on the tool bar).
Figure 13. Registers Window
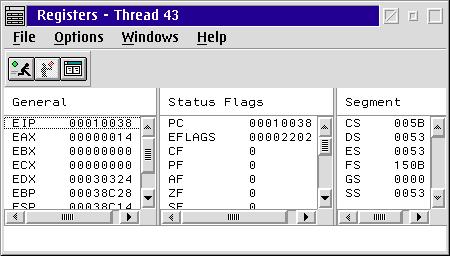
The contents of all of the registers except floating-point
registers are displayed in hexadecimal. To update a register,
double-click the register and a multiple-line field is displayed.
Type over the contents and press Enter.
If you decide not to change the value, press Esc.
In the Registers window, floating-point registers are displayed
as floating-point decimal numbers. They can be updated with a
floating-point decimal number or with a hexadecimal string that
represents a floating-point number.
From the menus of the Registers window you can:
- End the debugging session.
- Select the font to be displayed in the window, select the items
you want displayed in the window, restore the defaults, and
enable or disable the tool bar.
- Reset all your window settings to their original settings.
- Enable or disable the tool bar.
- Select whether you want hover help to be shown.
- Select to display the information area in the window.
- View a list of open windows, and select any open window
to display that window.
- Display help.
The Storage window
shows the storage contents and the address of the storage.
To display the Storage window, click
Storage (located within the Monitors menu)
or click the Storage button
(located on the tool bar).
Figure 14. Storage Window
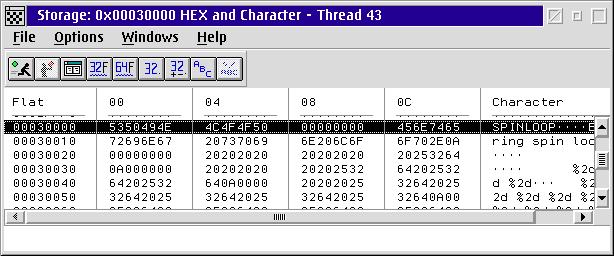
Multiple storage windows can display the same storage.
When you run a program
or update displayed data, the Storage window is updated
to reflect the change.
To update the storage contents and all affected windows, double-click
in the multiple-line field that is displayed.
Type over the contents of the field.
If you decide not to make the change, press Esc.
To specify a new address location, type over the address field
in the Storage window.
The window scrolls to the appropriate storage location.
From the menus of the Storage window you can:
Note: If you need help with any of the menus, press F1 while the
menu is selected.
You can monitor the local variables
(static, automatic, and parameter) for the
current execution point in the program from the Local Variables window.
The contents of the Local Variables window change each time
your program enters or leaves a function.
To display the Local Variables window, click
Local Variables
(located within the Monitors menu).
Figure 15. Local Variables Window

From the menus of the Local Variables window you can:
- End the debugging session.
- Delete, select, deselect, show other elements, or change
representation of the variables. You can copy the selected
local variable data to the clipboard.
You can also save the Local Variables window contents in a file.
Select
Options, Debugger settings,
and then Monitor properties
from the Debug Session Control window
or any of the source windows and enter
the file name in the Save file field.
- Control how the contents of variables display and set debugger
options.
- Select whether you want hover help to be displayed.
- Select to display the information area in the window.
- View a list of open windows, and select any open window
to display that window.
- Display help.
Note: If you need help with any of the menus, press F1 while the
menu is selected.
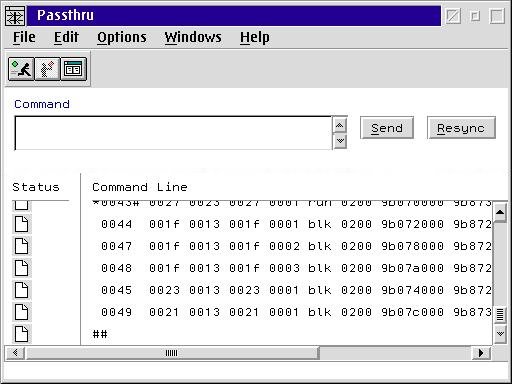
The Passthru window
allows you to send commands to KDB and view its responses.
The window has a Command entry
field where you enter the KDB commands, and a response
area that displays the KDB output.
The KDB response area can be scrolled, which enables you to
review previous KDB
responses from prior commands. This output area also appends a
status icon for each line to indicate your input, the debugger's
acceptance of that input, and text from KDB.
Note: When you send KDB commands using the Passthru window,
the debugger does not update its state. Thus, you should
use this window for obtaining information instead of altering
registers or data.
To display the Passthru window, click Passthru (located
within the Monitors menu) or click the
Passthru button
(located on the tool bar).
Figure 16. Passthru Window
To send a command to KDB, do the following:
- Type the command you want to send in the Command
entry field.
- Select the Send button
or press the Enter key.
- Select the Resync button
to force the debugger to refresh all of
its internal caches of the target computer state.
Use this button if you
used the Passthru window to alter the state on the target computer.
Note: Avoid commands that cause the target computer to resume execution
(for example, g and t).
They can cause the debugger to lock up.
The debugger tries to filter out the KDB commands that can cause
a lockup, but you should always exercise caution.
The debugger supports the execution of DEBUGO REXX command files.
To start a DEBUGO REXX command file, specify an * before the command
filename in the Command entry field. For example:
* memcount.cmd
would trigger the execution of the DEBUGO REXX command file
memcount.cmd.
From the Passthru window you can:
- End the debugging session.
- Edit or find lines in the response area.
- Select items you want displayed in the window.
- Save the contents of the Passthru window in a file.
Choose the file name by clicking Options from the menu
and then Display style.
Type the name of the file in the Output File field.
- Select the font used to display the information in the window.
- Reset all your window settings to their original settings.
- Add custom tool buttons.
- Enable or disable the tool bar.
- Select whether you want hover help to be displayed.
- Select to display the information area.
- Make the debugger act as though it is in ring-3 context.
This assumes that the current thread is at ring 0.
- View a list of open windows, and select any open window to display
that window.
- Display help.
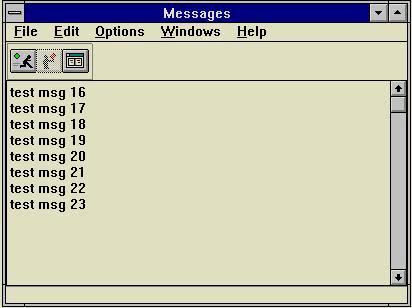
Use the Messages window to view printfs
that are emitted by the
kernel (diagnostic) code.
The contents of this window can be updated even while the debugger has
control and your program is quiesced.
To display the Messages window, click Messages
(located within the Monitors menu)
or click the Messages button
(located on the tool bar).
Figure 17. Messages Window
From the messages window you can:
Note: If you need help with any of the menus, press F1
while the menu is selected.
The debugger has four other windows that enable you to monitor variables
and expressions. These windows are as follows:
- Popup Monitor
- Program Monitor
- Private Monitor
- Storage Monitor
A Popup Monitor
window monitors single variables or expressions.
This window is associated with a specific source window and
closes when the associated window closes.
The Program Monitor, Private
Monitor, and Storage Monitor windows are used as collectors for
individual variables or expressions in which you might be interested.
The difference between the Private Monitor window and the
Program Monitor window is the length
of time that each remains open.
The Program Monitor window
remains open for the entire debugging session.
The Private Monitor window is associated with the
source window from which it was opened and closes when its
associated view is closed.
This section describes the expressions supported by the
debugger, which is a subset of C/C++.
This includes the operands, operators, and data types.
Note: You can display and update bit fields for C/C++ code only.
You cannot look at variables that have been defined using the #DEFINE
preprocessor directive.
You can monitor an expression that uses the following types of operands
only:
- Operand
- Definition
- Variable
- A variable used in your program.
- Constant
- The constant can be one of the following types:
- Registers
-
In the case of conflicting names, the program variable names take
precedence over the register names.
For conversions that are done automatically when the registers
are displayed
in mixed-mode expressions, general purpose registers are
treated as unsigned arithmetic items with
a length appropriate to the register.
If you monitor an enumerated variable, a comment is displayed
to the right of the value. If the value of the variable matches
one of the enumerated types, the comment contains the name of
the first enumerated type that matches the value of the variable.
If the length of the enumerated name does not fit in the monitor,
the contents are displayed as an empty field.
The comment (empty or not) lets you distinguish between a valid
enumerated value and a value that is not valid.
A value that is not valid
does not have a comment to the right of the value.
You cannot update an enumerated variable by entering
an enumerated type.
You must enter a value or expression.
If the value is a valid enumerated value,
the comment to the right of the value is updated.
Bit fields are supported for C/C++ compiled code only.
You can display and update bit
fields, but you cannot use them in expressions.
You cannot look at variables that have been defined
using the #DEFINE preprocessor directive.
You can monitor an expression that uses the following operators
only:
Table 1. Supported Expression Operators
| Operator
| Coded as
|
| Subscripting
| a[b]
|
| Member selection
| a.b or a->b
(a->b for C/C++ only)
|
| Size
| sizeof (a) or sizeof (type) (C++ only)
|
| Logical not
| !a
|
| One's complement
| ~a
|
| Unary minus
| -a
|
| Unary plus
| +a
|
| Dereference
| *a (C/C++ only)
|
| Type cast
| (type) a
|
| Multiply
| a * b
|
| Divide
| a / b
|
| Modulo
| a % b
|
| Add
| a + b
|
| Subtract
| a - b
|
| Left shift
| a << b
|
| Right shift
| a >> b
|
| Less than
| a < b
|
| Greater than
| a > b
|
| Less than or equal to
| a <= b
|
| Greater than or equal to
| a >= b
|
| Equal
| a == b
|
| Not equal
| a != b
|
| Bitwise AND
| a & b
|
| Bitwise OR
| a | b
|
| Bitwise exclusive OR
| a ^ b
|
| Logical AND
| a && b
|
| Logical OR
| a || b
|
You can monitor an expression that uses the following data types:
- 8-bit signed byte
- 8-bit unsigned byte
- 16-bit signed integer
- 16-bit unsigned integer
- 32-bit signed integer
- 32-bit unsigned integer
- 32-bit floating-point number
- 64-bit floating-point number
- 128-bit floating-point number
- Pointers
- User-defined types
- Structures
- Arrays
- Classes (C++ only)
The following paragraph does not apply to the United
Kingdom or any
country where such provisions are inconsistent with local
law:
INTERNATIONAL
BUSINESS MACHINES CORPORATION PROVIDES THIS PUBLICATION
"AS IS" WITHOUT WARRANTY OF ANY KIND, EITHER EXPRESS OR
IMPLIED, INCLUDING, BUT NOT LIMITED TO,
THE IMPLIED WARRANTIES OF MERCHANTABILITY OR FITNESS FOR A
PARTICULAR PURPOSE.
Some states do not allow disclaimer of express or implied warranties
in certain transactions, therefore, this statement may not
apply to you.
This publication could include technical inaccuracies or typographical
errors. Changes are periodically made to the information herein;
these changes will be incorporated in new editions of the publication.
IBM may make improvements and/or changes in the product(s) and/or
the program(s) described in this publication at any time.
This publication was developed for products and services offered in the
United States of America. IBM may not offer the products, services, or
features
discussed in this document in other countries, and the information is subject
to change without notice.
Consult your local IBM representative for information on the products,
services, and features available
in your area.
Requests for technical information about IBM
products should be made to your IBM reseller or IBM marketing representative.
© Copyright International Business Machines
Corporation 1999. All rights reserved.
Note to U.S. Government Users: Documentation related to
restricted rights - use, duplication or disclosure is
subject to
restrictions set forth in GSA ADP Schedule Contract with IBM
Corp.
References in this publication to IBM products, programs,
or services
do not imply that IBM intends to make these available in all countries
in which IBM operates.
Any reference to an IBM product, program or service is not intended to
state or imply that only that IBM product, program,
or service may be used.
Subject to IBM's valid intellectual property or other legally
protectable rights, any functionally equivalent product, program, or
service may be used instead of the IBM product, program, or service.
The evaluation and verification of operation in conjunction with other products,
except those expressly designated by IBM, are the responsibility of the user.
IBM may have patents or pending patent applications covering
subject matter in this document.
The furnishing of this document does not give you any
license to these patents.
You can send license inquiries, in writing, to:
IBM Director of Licensing
IBM Corporation
North Castle Drive
Armonk, NY 10504-1785
U.S.A.
Asia-Pacific users can inquire, in writing, to the IBM Director of
Intellectual Property and Licensing, IBM World Trade Asia Corporation,
2-31 Roppongi 3-chome, Minato-ku, Tokyo 106, Japan.
Licensees of this program who wish to have information about it for
the purpose of enabling: (i) the exchange of information between
independently created programs and other programs (including this
one) and (ii) the mutual use of the information which has been
exchanged, should contact IBM Corporation, Department LZKS,
11400 Burnet Road, Austin, TX 78758 U.S.A. Such information may be
available, subject to appropriate terms and conditions, including
in some cases, payment of a fee.
The following terms are trademarks of the IBM Corporation in
the United States, or other countries, or both:
IBM
OS/2
ThinkPad
Intel and Pentium are registered trademarks of the Intel Corporation
in the United States and/or other countries.
Other company, product, and service names
may be trademarks or service marks of others.
�