Why the Reuse Percent Metric should never be used alone
Wayne C. Lim
Lombard Hill Group
Email: wayne_lim@post.harvard.edu
URL: http://www.lombardhill.com
Abstract
Generally defined as the reused lines of code divided by the new and reused lines of code in percentage form, the Reuse Percent Metric (also known as 'reuse level' or 'reuse ratio' in decimal form) is used extensively throughout industry and academia. In an effort to reform the way that reuse researchers and practitioners use this metric, I present two major reasons why the Reuse Percent Metric should never be used alone in measuring the value and results of software reuse.
Keywords: Software Reuse, Reuse Metrics, Measurement, Reuse Ratio, Reuse Level, Percent Reuse Metric
Workshop Goals: Discuss and evangelize reuse issues
Working Groups: Reuse metrics and economics, Reuse strategies.
1 Background
The Reuse Percent Metric is generally defined as reused lines of code divided by the new and reused lines of code multiplied by 100% and is also known as 'reuse level' or 'reuse ratio' in decimal form. Reuse researchers and practitioners have extensively used the Reuse Percent Metric to describe reuse efforts and results (the author included). Indeed, Poulin [1] notes that this metric has become a de facto standard in measuring reuse levels.
2 Position
I wish to reform the way industry and academia use the Reuse Percent Metric. When used to measure the value of reuse, the Reuse Percent Metric possesses several limitations that should be taken into consideration. Users of the Reuse Percent Metric should understand these limitations and accompany its usage with other metrics, which would offset these insufficiencies. In the following section, I present two major reasons why the Reuse Percent Metric should never be used alone in measuring the value and progress of a software reuse program. (Lim, Wayne C., MANAGING SOFTWARE REUSE, 1998,pp.305-308. Reprinted by permission of Prentice Hall, Upper Saddle River, New Jersey.)
3 Approach
Use of the Percent Reuse metric by itself is not sufficient for the following two major reasons (in our examples below, multiplication by 100% to obtain the Reuse Percent Metric is implicit):
1) A product/system with a high percent reuse does not necessarily have a high or even positive net benefit.
Some people use the percent reuse level to approximate the amount of effort saved. A high reuse percentage, however, does not mean that the time and effort expended to achieve that level is justified, i.e., it may cost more than it is worth to achieve, say, a 90% reuse percent. First, the consumer cost to reuse needs to be measured; in the case where this consumer cost exceeds the benefit, then there is a net loss. Second, although the consumer may be experiencing a net gain (consumer benefits less consumer costs), the producer may be experiencing a net loss (sum of consumers' net gain/loss less producer's cost). Even if the percent reuse metric shows high levels, the organization could still be experiencing an economic loss from reuse.
2) The Percent reuse does not necessarily reflect effort saved from Reuse.
Example:
(Reused lines of code)/(Total lines of code = New and Reused lines of code) = 50/100 = 50%; but if only a portion would have been created by the consumer, e.g. (Avoided lines of code)/(New and Avoided lines of code) = 32/82 =39%, then the percent reuse metric does not reflect the effort saved.
The percent reuse level does not necessarily reflect the effort that was saved from reuse. For example, reuse of an asset may account for 50% of a product when the unit of measure is lines of code reused divided by new and reused lines of code. However, if the consumer would have actually only created a portion of the reusable asset had it not been available, then the 50% reuse percent level inflates the gains from reuse.
The difference between reused and avoided lines of code may be due to:
Let's examine the first three factors further. In using the Reuse Percent Metric, the gains from reuse may be inflated because of the way in which additional code to make the asset reusable, incorporate the reusable asset into the application, or "unactivated" code is accounted. (See below)
How the Percent Reuse Metric can Exaggerate the Benefits from Reuse
In this example, we use lines of code as our unit of measure. However, this analysis is applicable to other units of measure as well (e.g., function points, objects).
Let T be the total lines of code in a system/product if it were developed from scratch. If we utilize reusable code during development, the system/product will consist of lines of code developed expressly for the system/product (new code, N), lines of code reused (code which need not be developed, i.e., avoided lines of code, A), and lines of code added to make a nonreusable component reusable, incorporate a reusable component to the application, or provide alternative functionality which is not used ( R). So, let:
T = total lines of code for the product if it were developed from scratch
N = lines of new code
A = lines of code avoided by reusing
R = lines of code added to make the non-reusable component reusable, incorporate a reusable component to the application, or provide alternative functionality to the component which is not used.
(As an example of the latter, consider a utility, which handles input in a month/day/year format. Let us add lines of code to the utility enabling it to process input in either a day/month/year or year/day/month format Now consider an application which has a screen edit that will only allow data to be entered in a month/day/year format. When the application uses this utility, the lines which were added to provide the alternative functionality, i.e., input in day/month/year or year/day/month format are in a "ready-to-process" mode but never used.)
Since A expresses the lines that have been avoided by reusing, (A/T) is a closer approximation of effort saved than (A+R/T+R). However, most organizations use (A+R)/(T+R) because it is more easily collected.
The percent error of the Reuse Percent Metric due to counting lines that make the component reusable, incorporate a reusable component to the application, or add alternative functionality which is not used may be expressed as follows:
Percent Error = [[(A+R)/(T+R)] - (A/T)]/(A/T)
Let A = mT, where R = nT, where m is the percent of total lines avoided by reusing, and where n is the percent of total lines that are added to make the component reusable, incorporate a reusable component to the application, or add alternative functionality, which is not used.
so with substitution:
Percent Error = [(mT+nT)/(T+nT)-(mT/T)]/(mT/T)
= [((m+n)/(1+n))-m]/m
= (1/m)[(m+n)/(1+n)] — 1
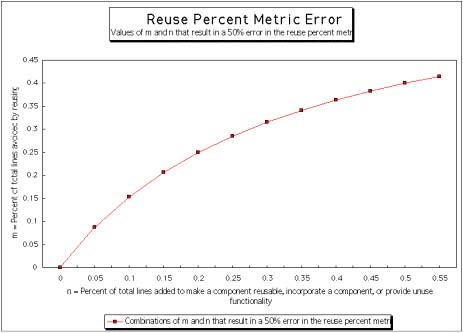
For example, if 20% of the total lines are added to make the component reusable, to incorporate a reusable component to the application, or to add alternative functionality which is not used (i.e., n=20%) and 25% of the total lines are lines that have been avoided by reusing (i.e., m=25%), then the percent error between the Reuse Percent Metric (A+R/T+R) and the more accurate ratio (A/T) is 50%. We can see in the following figure all the values of m and n that would result in a 50% error when (A+R/T+R) is used instead of (A/T):
Not having a benchmark of current organizational practices that enables us to determine what effort is actually avoided through reuse can lead to a misleading percent reuse metric. For example, some managers have used: KNCSS of subroutines/total KNCSS of product or (KNCSS of subroutines x no of times called)/total KNCSS of product. The problem with both measurements is that they do not necessarily capture the effort avoided.
For example, if the effort in creating new code is avoided twice when a subroutine is called twice, then the first metric misses this avoidance. The second measurement can overestimate the savings from reuse. For example, if the subroutine is called 10 times by ten engineers, but only 5 engineers would have coded the asset and the other 5 would have reused the asset, then only the effort of coding the asset 5 times has been avoided.
4 Comparison
To my knowledge, a number of sources report on the definition [2] and use of the Reuse Percent Metric, but none examine the limitations outlined in this position paper.
References
[1] Poulin, Jeffrey S., Measuring Software Reuse, Addison-Wesley, 1996.
[2] Frakes, William and Carol Terry, "Reuse Level Metrics," in Software Reuse: Advances in Software Reusability International Conference, Nov. 1-4, 1994.
Biography
Wayne C. Lim consults and specializes in the strategic planning, economic, organizational, and metric issues of software reuse. He is the author of numerous papers and a new reuse book, Managing Software Reuse: A Comprehensive Guide to Strategically Reengineering the Organization for Reusable Components, Prentice-Hall, 1998. He helped start Corporate Reuse Programs at Hewlett-Packard and Ford Aerospace. Mr. Lim is the recipient of the 1994 Best Article Award from IEEE Software for his research in reuse.
Mr. Lim completed his MBA degree at Harvard University, graduate engineering coursework at Stanford University, and an undergraduate degree in mathematics from Pomona College.