Fundamentals of SVG
A picture may be worth a thousand words, but is it worth a million bytes? That’s the question that faces web developers in the bandwidth-constricted world of mobile development. With Scalable Vector Graphics (SVG), you can create complex scalable vector graphics with very few bytes. This article gets you started with SVG on WebKit browsers, like Safari.
To start with, let's create a very simple SVG image, shown in Listing 1.
Listing 1: A simple SVG example
<?xml version="1.0" standalone="no"?>
<!DOCTYPE svg PUBLIC "-//W3C//DTD SVG 1.1//EN"
  "http://www.w3.org/Graphics/SVG/1.1/DTD/svg11.dtd">
<svg width="300px" height="300px" viewBox="0 0 400 400"
  xmlns="http://www.w3.org/2000/svg" version="1.1">
   <rect width="400" height="400"
    style="fill:none;stroke-width:3;stroke:rgb(64,64,64)" />
   <ellipse cx="150" cy="150" rx="75" ry="75"
    style="fill:rgb(255,0,0);stroke:rgb(128,128,128);stroke-width:5"/>
  <ellipse cx="200" cy="200" rx="75" ry="75"
    style="fill:rgb(0,255,0);stroke:rgb(128,128,128);stroke-width:5"/>
  <ellipse cx="250" cy="250" rx="75" ry="75"
    style="fill:rgb(0,0,255);stroke:rgb(128,128,128);stroke-width:5"/>
</svg>
As you can see, SVG is an XML-based declarative format. That means that you can create SVG images with just a simple text editor. And that any web server language, like PHP, JSP or Ruby on Rails, can create SVG images simply by building the appropriate XML output. There are no special libraries required to support SVG on the server side.
Looking again at the SVG file, we see that the main tag is the SVG root tag which defines the height and width of the image as well as the ‘viewBox’. The ‘viewBox’ defines the coordinate space for all of the drawing elements of the image. That coordinate space can be anything you choose. The top left can be negative for example, if you want to create a radial graph with the origin in the middle of the image. In this case, the upper left is located at 0,0 and the bottom right is located at 400, 400.
Within the SVG tag we have created four additional tags. The first tag, a ‘rect’ tag, defines a rectangle that bounds the edges of the image. The three additional tags, all of type ‘ellipse’ define some circular objects each with a different color as defined by their style attributes.
To make use of this SVG image see the very simple HTML file shown in Listing 2.
Listing 2: The HTML to include the SVG graphic
<html> <body> <img src="intro.svg" width="100" height="100" /> </body> </html>
As you can see the SVG file is used just like any image on your webpage, with an image tag.
When you test this code by navigating to the webpage on your iPhone, you should see the screen shown in Figure 1.
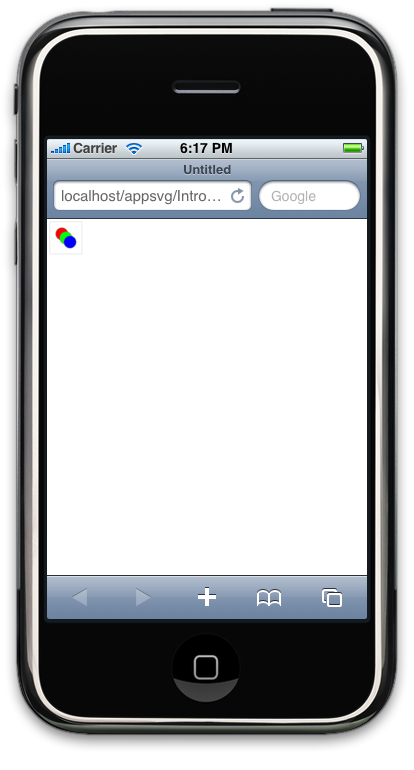
Figure 1. The beginning SVG page
There is the rectangle bounding the images, and the set of three circles each with a different color.
To demonstrate how well SVG scales, let's add a little complexity to the webpage and allow it to handle a finger press on the image. If you press the image it’s going to scale up to 400x400 and see how the image scales to handle that.
The code for this interactive page is shown in Listing 3.
Listing 3: An interactive SVG
<html>
<head>
<script>
function mouseover() {
	document.getElementById('svgpic').width = '400';
	document.getElementById('svgpic').height = '400';
}
function mouseout() {
	document.getElementById('svgpic').width = '100';
	document.getElementById('svgpic').height = '100';
}
</script>
</head>
<body>
  <img src="intro.svg" width="100" height="100" id="svgpic"
    onmouseover="mouseover();" onmouseout="mouseout();" />
</body> </html>
When you bring this page up in the browser and then click on the image. You should see the something like Figure 2 on your iPhone.
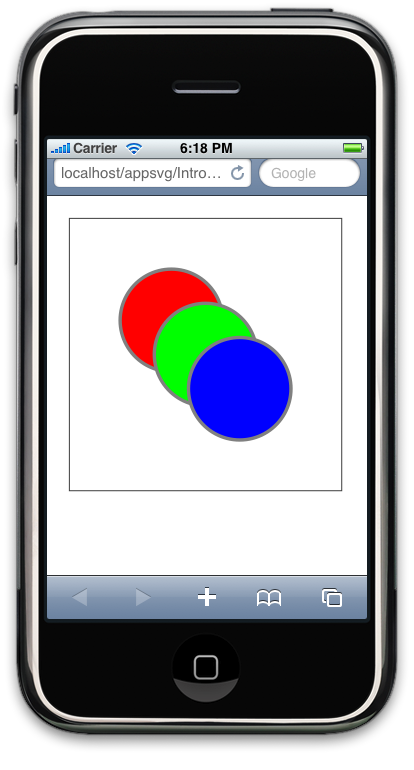
Figure 2. The zoomed SVG image
As you can see the image has scaled very nicely. There are no jagged edges to be found. This is because SVG is a ‘vector’ graphics format. That means that image rendering engine knows that the elements are circles and rectangles, instead of just a series of pixels, so it can draw them at any resolution without any loss of image quality.
To illustrate even further, here is a kind of "taste test" between, on one hand, an SVG image, and the same image copied as a bitmap then scaled up. These two images are shown overlapping in Figure 3.
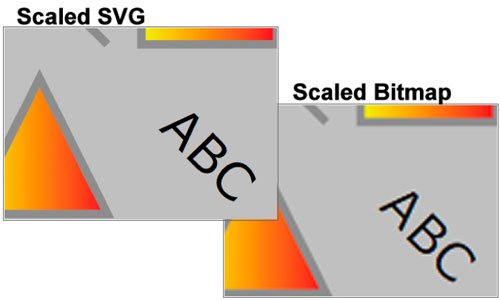
Figure 3. SVG scaling versus bitmap scaling
Look at the side of the triangle and the jaggies around the letter ‘A’ in the bitmap file. Then see how clean this image is on SVG. Because SVG is a vector format it can be scaled perfectly without any loss of image quality.
That’s not the only benefit of SVG. If, for example, you take the intro1.svg file and copy it to a bitmap then store it as a JPG, you'll see that the SVG file is 669 bytes and the JPG is 13,115. The SVG is almost 1/20th of the size of the JPG. GIF scores a little better because it weighs in at 4,726 bytes. So not only are the JPG and GIF images substantially larger in byte count, they don’t maintain the vector information, so they scale very poorly. Clearly, if you can, you should use SVG.
Styles
So far we've discussed only the most simple SVG just to illustrate the advantages. Now let's consider a bit more what SVG can do.
To begin, let's take a look at SVG styles. Like an HTML document you can use CSS within an SVG document to style the particular elements. For example, in intro1.svg all of the ellipses had a heavy grey border. So instead of defining that on each one, you can create a style for all ellipses that defines the heavy grey border. This is shown in Listing 4.
Listing 4: SVG circles
<?xml version="1.0" standalone="no"?>
<!DOCTYPE svg PUBLIC "-//W3C//DTD SVG 1.1//EN"
  "http://www.w3.org/Graphics/SVG/1.1/DTD/svg11.dtd">
<svg width="300px" height="300px" viewBox="0 0 400 400"
  xmlns="http://www.w3.org/2000/svg" version="1.1">
<defs><style type="text/css"><![CDATA[
ellipse { stroke-width: 5; stroke:rgb(128,128,128); }
]]></style></defs>
   <rect width="400" height="400"
    style="fill:none;stroke-width:3;stroke:rgb(64,64,64)" />
   <ellipse cx="150" cy="150" rx="75" ry="75"
    style="fill:rgb(255,0,0);"/>
  <ellipse cx="200" cy="200" rx="75" ry="75"
    style="fill:rgb(0,255,0);"/>
  <ellipse cx="250" cy="250" rx="75" ry="75"
    style="fill:rgb(0,0,255);"/>
</svg>
To define the style for ellipses, we have created a ‘defs’ tag which will hold definitions for the SVG file. Within that we create a ‘styles’ tag which holds the CSS. That CSS defines that for ‘ellipse’ tags the stroke-width should be 5, and the stroke should be grey.
This only take a few bytes off of this particular example. But you can still do a little better by creating classes for red, green and blue fills on the ellipses. This code is shown in Listing 5.
Listing 5: SVG circles with styles
<?xml version="1.0" standalone="no"?>
<!DOCTYPE svg PUBLIC "-//W3C//DTD SVG 1.1//EN"
  "http://www.w3.org/Graphics/SVG/1.1/DTD/svg11.dtd">
<svg width="300px" height="300px" viewBox="0 0 400 400"
  xmlns="http://www.w3.org/2000/svg" version="1.1">
<defs><style type="text/css"><![CDATA[
ellipse { stroke-width: 5; stroke:rgb(128,128,128); }
.red { fill:rgb(255,0,0); }
.blue { fill:rgb(0,255,0); }
.green { fill:rgb(0,0,255); }
]]></style></defs>
   <rect width="400" height="400"
    style="fill:none;stroke-width:3;stroke:rgb(64,64,64)" />
   <ellipse cx="150" cy="150" rx="75" ry="75" class="red"/>
   <ellipse cx="200" cy="200" rx="75" ry="75" class="green"/>
   <ellipse cx="250" cy="250" rx="75" ry="75" class="blue"/>
</svg>
This cuts about 5% of the bulk out of the original file. As you can imagine, when this is applied to large files the savings for using styles is dramatic.
More with SVG
Showing rectangles and ellipses is fine, but that’s hardly all SVG can do. In fact, it has a full array of vector tools that are at your disposal. The ‘examples’ SVG file shown in Listing 6 shows a selection of these primitives.
Listing 6: A selection of SVG primitives
<?xml version="1.0" standalone="no"?>
<!DOCTYPE svg PUBLIC "-//W3C//DTD SVG 1.1//EN"
  "http://www.w3.org/Graphics/SVG/1.1/DTD/svg11.dtd">
<svg width="300px" height="150px" viewBox="0 0 400 200"
  xmlns="http://www.w3.org/2000/svg" version="1.1"
  xmlns:xlink="http://www.w3.org/1999/xlink">
<defs>
<linearGradient id="orange_red" x1="0%" y1="0%" x2="100%" y2="0%">
<stop offset="0%" style="stop-color:rgb(255,255,0);stop-opacity:1"/>
<stop offset="100%" style="stop-color:rgb(255,0,0);stop-opacity:1"/>
</linearGradient>
<style type="text/css"><![CDATA[
.thick { stroke-width: 5; stroke:rgb(128,128,128); fill:url(#orange_red); opacity:0.8; }
]]></style></defs>
   <rect width="400" height="200"
    style="fill:none;stroke-width:3;stroke:rgb(64,64,64);fill:rgb(192,192,192);" />
   <ellipse cx="50" cy="50" rx="35" ry="15" class="thick"/>
   <line x1="110" y1="10" x2="190" y2="90" class="thick" />
   <rect width="80" height="80" x="210" y="10" class="thick" />
   <circle cx="350" cy="50" r="35" class="thick" />
   <polyline class="thick" points="70,110 90,190 10,190 30,110" />
   <polygon class="thick" points="150,110 190,190 110,190 150,110" />
   <g transform="translate(220,140),rotate(45)">
     <text font-family="Verdana" font-size="30">ABC</text>
   </g>
   <g transform="translate(330,100),rotate(10)">
   <image width="60px" height="80px" xlink:href="megan.jpg" />
   </g>
</svg>
At the top of the file, in the ‘defs’ section, we’ve defined a new gradient fill pattern and then used at that in the ‘thick’ CSS class as the fill pattern. Then in the body of the document are several different graphical elements including lines, polygons, text and even an image. The result is shown in Figure 4.
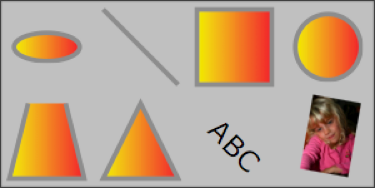
Figure 4. The example SVG in action
As with all SVGs, this image will scale up as large as you want while maintaining its quality. In particular, the gradient fills will just get smoother as you zoom in on them. The image in the lower right of the young girl will, unfortunately, start to pixelize as you zoom in, but that’s the nature of a bitmap image.
In addition to a full bevy of graphics primitives like lines, polygons, text, images and so on, SVG also allows for a wide variety of graphical effects. These include adjusting the Alpha of each object, applying transformations like offsets, rotations, skewing, and so forth. It also allows for creating a grouped object then invoking that over and over again. This can be helpful when you want to create marker nodes on a graph.
Conclusion
The advantages for using SVG for graphing and visualization applications are clear. Not only is it more efficient in terms of file size to use SVG, it also scales better, looks cleaner, and is easier to build because libraries are not required to create the XML. If what you want to do is create charts and graphs to display data quickly on the iPhone, SVG should be one of your tools of choice.
Posted: 2009-02-24