Making Graphics with Canvas on iPhone
If you are not familiar with Canvas, it is worth getting to know this very useful HTML tag. The canvas tag gives you a full fledged drawing surface anywhere in your HTML page. You can use images, vectors, arcs, fills, strokes, radial fills, gradients, alpha blending and more. And since it works on iPhone, you can present interactive graphics, charts and animations, with a whole lot less bandwidth and without plugins.
In this article we present three different real-world scenarios where you can use the canvas tag on iPhone. The first is an interactive example where the user can use stamps to fill up a canvas with images and graphics. The second example uses a Javascript timer to animate an image within the canvas. The third example shows an all-Javascript-based graph.
Each of these examples demonstrates how the canvas control is superior to using the equivalent jpeg or animated gif. Not only are the downloads smaller, but the code is easier to maintain and develop.
A Simple Stamper Application
Anyone with small children will have had experience with stamps. They are certainly one of the cheapest ways to keep kids entertained. Give them some paper and a bunch of self inking stamps and they can play for hours. So why not make an electronic version of the same?
Listing 1 shows a very simple stamper application that uses the drawImage method on the canvas to place an image wherever the user touches the canvas.
Listing 1: stamper1.html
<html><head>
<meta name="viewport" content="width=320;height=420;user-scalable=no;initial-scale=1.0;">
<style>
body { padding:0px; margin:0px; }
</style>
<script>
var img = new Image();
img.src = 'images/megan2.jpg';

function mouseup( event )
{
  var ctx = document.getElementById('canvas').getContext('2d');
  ctx.drawImage( img, event.clientX - 37, event.clientY - 50 );
}

function startup() {
  var ctx = document.getElementById('canvas').getContext('2d');
  var lingrad = ctx.createLinearGradient(0,0,0,600);
  lingrad.addColorStop(0, '#fff');
  lingrad.addColorStop(1, '#ccc');
  ctx.fillStyle = lingrad;
  ctx.fillRect(0,0,320,420);
  setTimeout(function() { window.scrollTo(0,1); }, 0);
}
</script>
</head>
<body onload="startup()">
<canvas id="canvas" width="320" height="420" onmouseup="mouseup(event)"></canvas>
</body>
</html>
The important HTML elements on the page are at the top and the bottom. The top is where the <meta> tag is defined that lays out the page correctly for iPhone. At the bottom of the page is the body section which contains the all important canvas tag where we will draw the images.
The canvas tag responds to the mouse up event by calling the 'mouseup' function in the Javascript block. The 'mouseup' function uses the 'drawImage' method on the canvas' 2D context to draw the image at the mouse location. That 'startup' function, which is called by the 'onload' event on the body, fills the background with a nice gradient fill.
After this is loaded up on iPhone and you use your finger to tap around a little bit, you should see something like Figure 1.
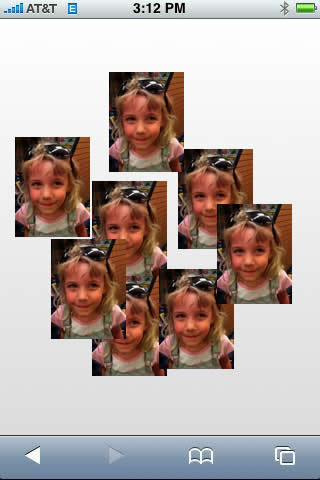
Figure 1: The first version of the stamper
To make this a little more interactive, and to demonstrate more of the canvas API, we now add a tools section at the bottom of the page from which the user can select one of three drawing tools. The first is the picture, the second is a star shaped stamp, and the third is a circle. To make it even a little more interesting the star and circle will be rendered semi-transparent.
This updated code is shown in Listing 2.
Listing 2: stamper2.html
<html>
<head>
<meta name="viewport" content="width=320;height=420;user-scalable=no;initial-scale=1.0;">
<style>
body { padding:0px; margin:0px; }
</style>
<script>
var img = new Image();
img.src = 'images/megan2.jpg';

var mode = 'img';

function setmode( newmode ) { mode = newmode; }

function mouseup( event )
{
  var ctx = document.getElementById('canvas').getContext('2d');
  if ( mode == 'img' )
    ctx.drawImage( img, event.clientX - 37, event.clientY - 50 );
  if ( mode == 'circle' ) {
    ctx.save();
    ctx.fillStyle = "rgb(200,0,0)";
    ctx.globalAlpha = 0.5;
    ctx.arc(event.clientX,event.clientY,50,0,Math.PI*2,true);
    ctx.fill();
    ctx.restore();
   }
  if ( mode == 'star' ) {
    ctx.save();
    ctx.fillStyle = "rgb(0,200,0)";
    ctx.globalAlpha = 0.5;
    var ox = event.clientX;
    var oy = event.clientY;
    ctx.moveTo( ox + ( Math.sin( 0 ) * 50 ), oy + ( Math.cos( 0 ) * 50 ) );
    for( var pt = 0; pt < 31; pt++ ) {
      var rads = ( ( 360 / 30 ) * pt ) * 0.0174532925;
      var radius = ( pt % 2 == 1 ) ? 50 : 30;
      ctx.lineTo( ox + ( Math.sin( rads ) * radius ), oy + ( Math.cos( rads ) * radius ) );
    }
    ctx.fill();
    ctx.restore();
   }
}

function startup() {
  var ctx = document.getElementById('canvas').getContext('2d');
  var lingrad = ctx.createLinearGradient(0,0,0,600);
  lingrad.addColorStop(0, '#fff');
  lingrad.addColorStop(1, '#ccc');
  ctx.fillStyle = lingrad;
  ctx.fillRect(0,0,320,380);
  setTimeout(function() { window.scrollTo(0,1); }, 0);
}
</script>
</head>
<body onload="startup()">
<canvas id="canvas" width="320" height="380" onmouseup="mouseup(event)"></canvas>
<table width="320" style="border:0px;" cellspacing="1" cellpadding="2">
<tr>
<td width="33%" height="40" style="background:black;color:white;" valign="middle" align="center"
  onclick="setmode('img')">
<img src="images/picture.png"></td>
<td width="33%" height="40" style="background:black;color:white;" valign="middle" align="center"
  onclick="setmode('star')">
<img src="images/star.png"></td>
<td width="33%" height="40" style="background:black;color:white;" valign="middle" align="center"
  onclick="setmode('circle')">
<img src="images/circle.png"></td>
</tr>
</table>
</body>
</html>
The bit change here is in the 'mouseup' function that draws a stamp based on the currently selected mode. The mode is determined by clicks on the table cells at the bottom of the page.
The 'star' mode uses a little trigonometry along with the 'moveTo' and 'lineTo' methods to draw a nice multipointed star. And the 'circle' mode uses the 'arc' method on the canvas context to draw a complete circle. You can draw whatever portion of the circle you like as the 'arc' function takes a starting and ending angle which are defined in radians. The 'globalAlpha' on the context defines the alpha for the active drawing. You can also set compositing modes, clipping, rotation and much more.
To play with this version, bring it up on your iPhone and use your finger to select modes and stamp. After a bit of playing you might end up with something like Figure 2.
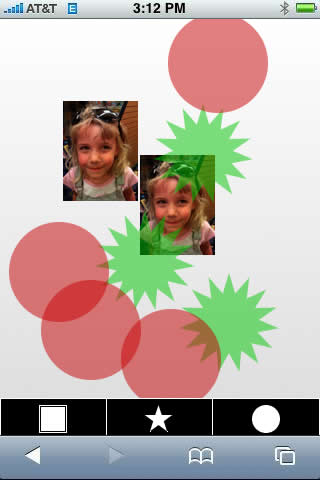
Figure 2: The upgraded stamper
With an example of interaction with the canvas tag in hand, we now turn our attention to animation.
Animating On The Canvas Tag
If you are already familiar with animation in Dynamic HTML, animating a canvas tag will be very familiar to you. It starts with creating a timer using the setInterval mechanism. Then redrawing the canvas on each update. A simple example of moving an image around on a timer is shown in Listing 3.
Listing 3: animation.html
<html>
<head>
<meta name="viewport" content="width=320;height=420;user-scalable=no;initial-scale=1.0;">
<style>
body { padding:0px; margin:0px; }
</style>
<script>
var img = new Image();
img.src = 'images/megan2.jpg';

var xPos = 0, xDir = 1;
var yPos = 0, yDir = 1;

function update() {
  var ctx = document.getElementById('canvas').getContext('2d');
  var lingrad = ctx.createLinearGradient(0,0,0,600);
  lingrad.addColorStop(0, '#fff');
  lingrad.addColorStop(1, '#ccc');
  ctx.fillStyle = lingrad;
  ctx.fillRect(0,0,320,420);

  ctx.drawImage( img, xPos, yPos );

  xPos += ( xDir * 5 );
  if ( xPos > 240 ) xDir = -1;
  if ( xPos < 5 ) xDir = 1;
  yPos += ( yDir * 5 );
  if ( yPos > 320 ) yDir = -1;
  if ( yPos < 5 ) yDir = 1;
}
function startup() {
  setTimeout( function() { window.scrollTo(0,1); }, 0 );
  setInterval( update, 50 );
}
</script>
</head>
<body onload="startup()">
<canvas id="canvas" width="320" height="420"></canvas>
</body>
</html>
The 'update' function which is called by the timer redraws the background on each pass, thus overwriting the previous content, and redraws the image in a new location that moves back and forth both horizontally and vertically.
When you bring up this code in your browser you see something similar to Figure 3.
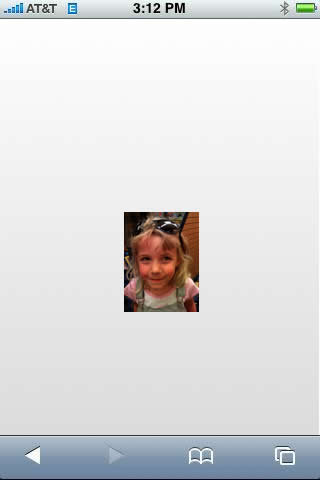
Figure 3: The simple animation caught in motion
Though, of course, this still shot misses the animation afforded by the code.
If you have a more complex static background, you might want to consider using multiple layered canvas tags so that you don't have to redraw the entire scene on each pass. Canvas tags, just as with any other type of tag, can be placed anywhere on the page and in any quantity you wish. As an example, you can easily replace simple geometric images with canvas tags to reduce bandwidth. And as you can see from this example, you can also animate the image to add some spark to the page.
On iPhone it's important to realize that intervals are only serviced when the browser is active. This shouldn't be an issue given that most animations aren't mission critical. But it's good to realize that you aren't going to waste a lot of processor power on iPhone by using an interval timer.
Our final example is using the canvas tag to build a graph.
Graphing With The Canvas Tag
Graphs are data visualizations that are uniquely effective on iPhone. They present relevant data quickly, and are easier to read than text on the small iPhone form factor. But graphs can be expensive on bandwidth if you use images generated on the server to build them.
Fortunately, there is an alternative: building the graph using a canvas tag. In this case we will use the open source CanvasGraph.js library, but you can write your own or use one of the many other open source or commercial packages.
The code that displays a simple traffic graph is shown in Listing 4.
Listing 4: graph.html
<html>
<head>
<meta name="viewport" content="width=320;height=420;user-scalable=no;initial-scale=1.0;">
<script src="MochiKit/lib/MochiKit/MochiKit.js"></script>
<script src="CanvasGraph.js"></script>
<style>
body { padding:0px; margin:0px; }
</style>
<script>
function startup() {
  var graph = new CanvasGraph("canvas");
  graph.setDataset("pages", [[0,2200], [1,2400], [2,3000], [3,1800], [4,1400], [5,1200]]);
  graph.setDataset("wsrequests", [[0,600], [1,900], [2,1100], [3,400], [4,200], [5,700]]);
  graph.drawLinePlot({"pages": Color.blueColor(),
    "wsrequests": Color.redColor()});
}
</script>
</head>
<body onload="startup()">
<canvas id="canvas" width="320" height="420"></canvas>
</body>
</html>
The CanvasGraph object, implemented in the CanvasGraph.js file, handles building the graph from the data provided using the 'setDataset' method calls. The 'drawLinePlot' then draws the graph onto the specified canvas. There many types of visualizations available with this package including bar graphs, pie charts, line graphs and more.
When you bring up the graphing page on iPhone it looks similar to Figure 4.
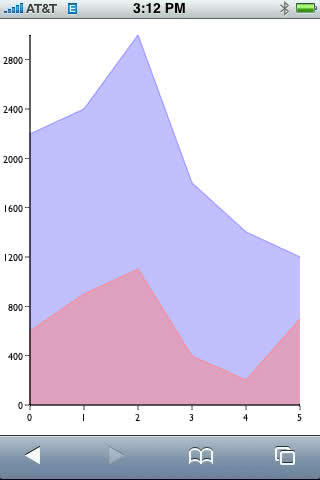
Figure 4: A graph drawn on the canvas
If you were to build a graph onto a bigger canvas and change the viewport meta tag to match, the user could use a finger to scroll around the canvas along with the pinching gestures to zoom in and out. All of that comes for free from the underlying Safari browser.
Where To Go From Here
This article has shown just a few ways to take advantage of the canvas tag. The graphics primitives provides allow you to stroke lines, fill complex patterns with gradient fills, alter opacity, perform matrix transforms, draw text and images. In short all of the basics are provided for any types of graphic operations you want to perform. And it's not just on the Safari browser, but any modern browser that supports the HTML 5 standard.
Posted: 2008-10-14