iOS Developer Tools
To develop applications for iOS, you need a Mac OS X computer running the Xcode tools. Xcode is Apple’s suite of development tools that provide support for project management, code editing, building executables, source-level debugging, source-code repository management, performance tuning, and much more. At the center of this suite is the Xcode application itself, which provides the basic source-code development environment. Xcode is not the only tool you use though, and the following sections provide an introduction to the key applications you use to develop software for iOS.
Xcode
The focus of your development experiences is the Xcode application. Xcode is an integrated development environment (IDE) that provides all of the tools you need to create and manage your iOS projects and source files, build your code into an executable, and run and debug your code either in iPhone Simulator or on a device. Xcode incorporates a number of features to make developing iOS applications easier, including the following:
A code-editing environment that includes features such as syntax coloring, code completion, and symbol indexing
An advanced documentation viewer for viewing and searching Apple documentation
A context-sensitive inspector for viewing information about selected code symbols
An advanced build system with dependency checking and build rule evaluation
GCC compilers supporting C, C++, Objective-C, Objective-C++, and Objective-C 2.0, and other languages
Integrated source-level debugging using GDB
Distributed computing, enabling you to distribute large projects over several networked machines
Predictive compilation that speeds single-file compile turnaround times
Advanced debugging features such as fix and continue and custom data formatters
Advanced refactoring tools that let you make global modifications to your code without changing its overall behavior
Support for project snapshots, which provide a lightweight form of local source-code management
Support for launching performance tools to analyze your software
AppleScript support for automating the build process
Support for DWARF and Stabs debugging information (DWARF debugging information is generated by default for all new projects)
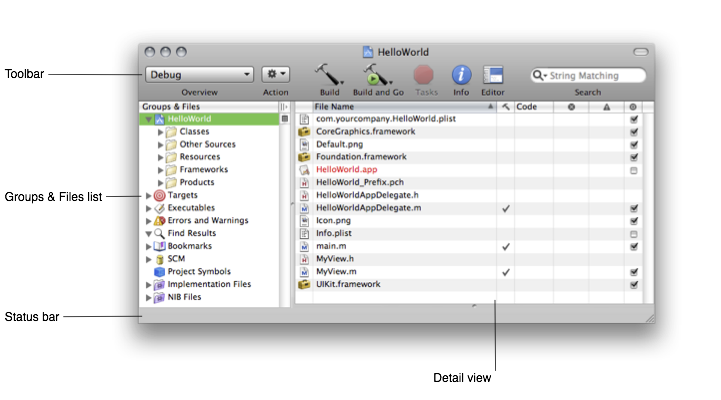
To create a new iOS application, you start by creating a new project in Xcode. A project manages all of the information associated with your application, including the source files, build settings, and rules needed to put all of the pieces together. The heart of every Xcode project is the project window, shown in Figure A-1. This window provides quick access to all of the key elements of your application. In the Groups and Files list, you manage the files in your project, including the source files and build targets that are created from those source files. In the toolbar, you access commonly used tools and commands. And in the details pane, you can configure a space for working on your project. Other aspects of the project window provide you with contextual information about your project.
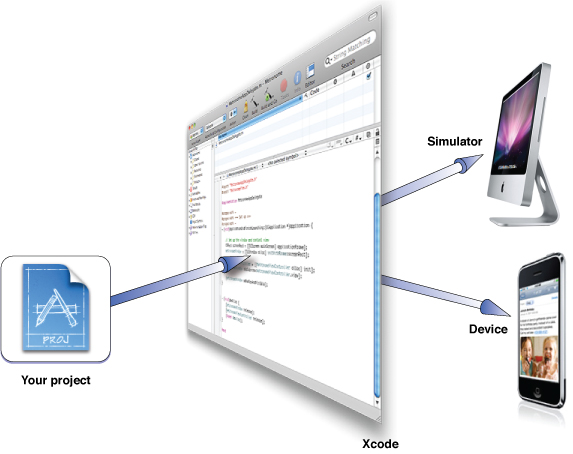
When you build your application in Xcode, you have a choice of building it for iPhone Simulator or for a device. The simulator provides a local environment for testing your applications to make sure they behave essentially the way you want. After you are satisfied with your application’s basic behavior, you can tell Xcode to build your application and run it on an iOS-based device connected to your computer. Running your application on a device provides the ultimate test environment, and Xcode lets you attach the built-in debugger to the code running there.
For details on how to build and run your project on iOS, see iOS Development Guide. For more information about the overall Xcode environment, see A Tour of Xcode.
Interface Builder
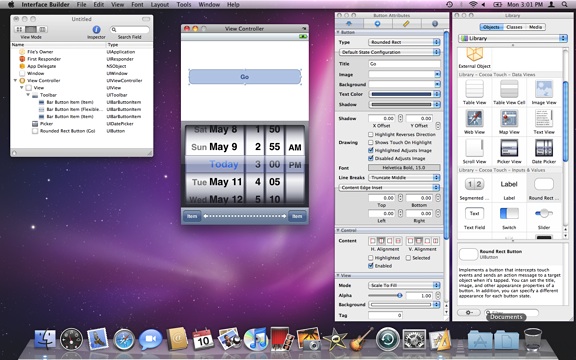
Interface Builder is the tool you use to assemble your application’s user interface visually. Using Interface Builder, you assemble your application’s window by dragging and dropping preconfigured components onto it, as shown in Figure A-3. The components include standard system controls such as switches, text fields, and buttons, and also custom views to represent the views your application provides. After you’ve placed the components on the window’s surface, you can position them by dragging them around, configure their attributes using the inspector, and establish the relationships between those objects and your code. When your interface looks the way you want it, you save the contents to a nib file, which is a custom resource file format.
The nib files you create in Interface Builder contain all the information that UIKit needs to recreate the same objects in your application at runtime. Loading a nib file creates runtime versions of all the objects stored in the file, configuring them exactly as they were in Interface Builder. It also uses the connection information you specified to establish connections between the newly created objects and any existing objects in your application. These connections provide your code with pointers to the nib-file objects and also provide the information the objects themselves need to communicate user actions to your code.
Overall, using Interface Builder saves a tremendous amount of time when it comes to creating your application’s user interface. Interface Builder eliminates the custom code needed to create, configure, and position the objects that make up your interface. Because it is a visual editor, you get to see exactly what your interface will look like at runtime.
For more information about using Interface Builder, see Interface Builder User Guide.
Instruments
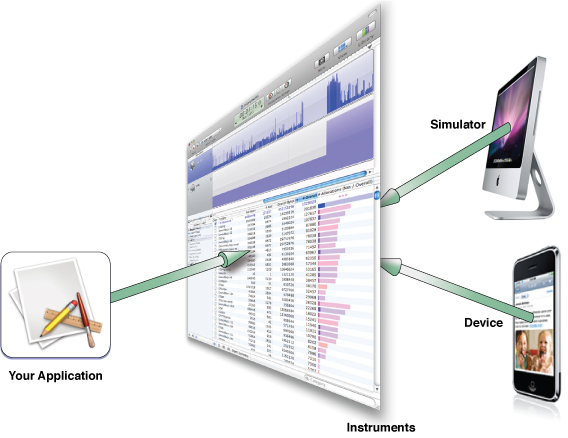
To ensure that you deliver the best user experience for your software, the Instruments environment lets you analyze the performance of your iOS applications while running in the simulator or on a device. Instruments gathers data from your running application and presents that data in a graphical display called the timeline. You can gather data about your application’s memory usage, disk activity, network activity, and graphics performance. The timeline view can display all of the different types of information side by side, letting you correlate the overall behavior of your application, not just the behavior in one specific area. To get even more detailed information, you can also view the detailed samples that Instruments gathers.
In addition to providing the timeline view, Instruments provides tools to help you analyze your application’s behavior over time. For example, the Instruments window lets you store data from multiple runs so that you can see whether your application’s behavior is actually improving or whether it still needs work. You can save the data from these runs in an Instruments document and open them at any time.
For details on how to use Instruments with iOS applications, see iOS Development Guide. For general information on how to use Instruments, see Instruments User Guide.
Shark
Shark is a powerful tool that you can use to analyze the performance of your iOS applications. Shark lets you profile your code using several different options while it is running on an iOS–based device. The results of profiling are a statistical sampling of your application’s runtime behavior that can be viewed and analyzed using the Shark data mining and charting tools. These tools can help you visualize your program’s runtime behavior and identify potential hot spots.
For more information about using Shark with iOS–based devices, see Shark User Guide.
Last updated: 2010-07-08